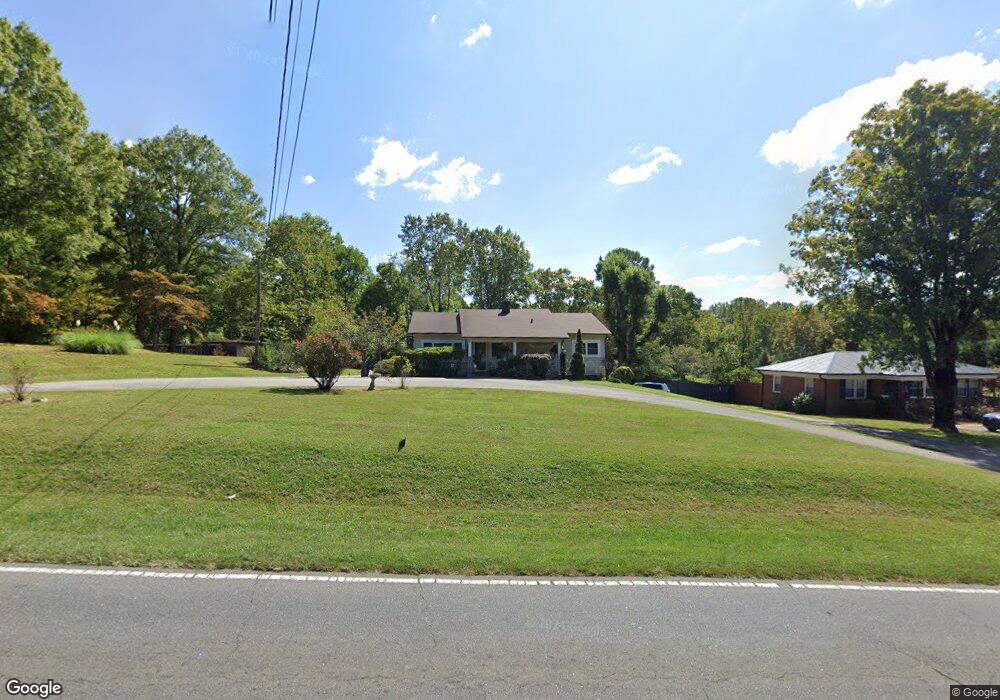
743 W C St Newton, NC 28658
Estimated Value: $203,000 - $238,453
2
Beds
2
Baths
1,396
Sq Ft
$158/Sq Ft
Est. Value
About This Home
This home is located at 743 W C St, Newton, NC 28658 and is currently estimated at $220,863, approximately $158 per square foot. 743 W C St is a home located in Catawba County with nearby schools including South Newton Elementary School, Newton-Conover Middle School, and Newton-Conover High School.
Ownership History
Date
Name
Owned For
Owner Type
Purchase Details
Closed on
Dec 7, 2018
Sold by
S & Tc Properties Inc
Bought by
S & Tc Properties Inc
Current Estimated Value
Purchase Details
Closed on
Mar 26, 2014
Sold by
Coley Joseph A and Coley Regina
Bought by
S & T C Properties Inc
Home Financials for this Owner
Home Financials are based on the most recent Mortgage that was taken out on this home.
Original Mortgage
$80,000
Outstanding Balance
$60,952
Interest Rate
4.4%
Mortgage Type
Future Advance Clause Open End Mortgage
Estimated Equity
$159,911
Purchase Details
Closed on
Jul 31, 2013
Sold by
Mebane Doris C and Bogle Sylvia C
Bought by
Coley Joseph Albert and Coley Dwaine Clark
Purchase Details
Closed on
Jul 14, 1954
Purchase Details
Closed on
Oct 26, 1951
Bought by
Coley Joseph Alonzo and Coley Mavis
Create a Home Valuation Report for This Property
The Home Valuation Report is an in-depth analysis detailing your home's value as well as a comparison with similar homes in the area
Home Values in the Area
Average Home Value in this Area
Purchase History
| Date | Buyer | Sale Price | Title Company |
|---|---|---|---|
| S & Tc Properties Inc | -- | None Available | |
| S & T C Properties Inc | $80,000 | None Available | |
| Coley Joseph Albert | -- | None Available | |
| -- | -- | -- | |
| Coley Joseph Alonzo | -- | -- |
Source: Public Records
Mortgage History
| Date | Status | Borrower | Loan Amount |
|---|---|---|---|
| Open | S & T C Properties Inc | $80,000 |
Source: Public Records
Tax History Compared to Growth
Tax History
| Year | Tax Paid | Tax Assessment Tax Assessment Total Assessment is a certain percentage of the fair market value that is determined by local assessors to be the total taxable value of land and additions on the property. | Land | Improvement |
|---|---|---|---|---|
| 2025 | $1,548 | $182,100 | $17,500 | $164,600 |
| 2024 | $1,548 | $182,400 | $17,800 | $164,600 |
| 2023 | $1,548 | $182,400 | $17,800 | $164,600 |
| 2022 | $1,231 | $110,400 | $17,800 | $92,600 |
| 2021 | $1,231 | $110,400 | $17,800 | $92,600 |
| 2020 | $1,231 | $110,400 | $17,800 | $92,600 |
| 2019 | $1,231 | $110,400 | $0 | $0 |
| 2018 | $972 | $87,200 | $11,300 | $75,900 |
| 2017 | $972 | $0 | $0 | $0 |
| 2016 | $972 | $0 | $0 | $0 |
| 2015 | $949 | $87,160 | $11,300 | $75,860 |
| 2014 | $949 | $94,000 | $11,500 | $82,500 |
Source: Public Records
Map
Nearby Homes
- 000 Long Dr
- 1031 Long Dr
- 1152 Long Dr
- 515 S Ashe Ave
- 215 W D St
- 743 S College Ave
- 355 S College Ave
- 221 E Herman St
- 718 W 1st St W Unit 56 Pt 58
- 1326 Brentwood Dr
- 504 N Spring Ave
- 437 E D St
- 1115 Sandhurst Dr Unit 9
- 1401 Southwest Blvd
- 406 S Caldwell Ave
- 426B E N St
- 250 S Caldwell Ave
- 127 S Caldwell Ave
- 108 Pinehurst Ln
- 628 W 8th St