Estimated Value: $435,000 - $658,000
3
Beds
3
Baths
1
Sq Ft
$578,547/Sq Ft
Est. Value
About This Home
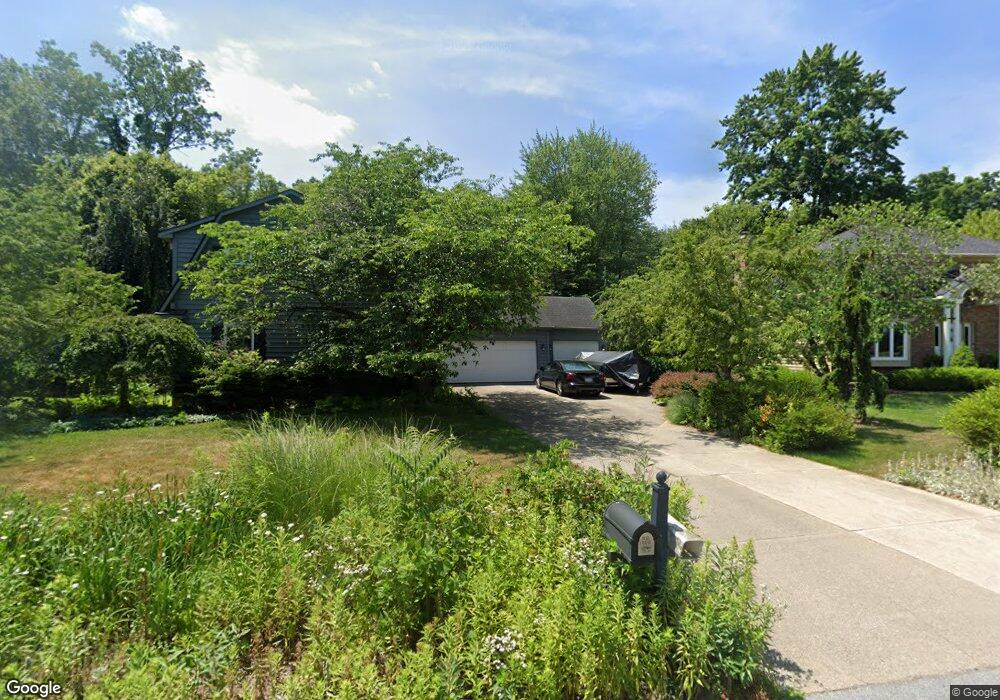
This home is located at 743 W Woodmeade Ct SE, Ada, MI 49301 and is currently estimated at $578,547, approximately $578,547 per square foot. 743 W Woodmeade Ct SE is a home located in Kent County with nearby schools including Collins Elementary School, Northern Trails 5/6 School, and Northern Hills Middle School.
Ownership History
Date
Name
Owned For
Owner Type
Purchase Details
Closed on
Sep 28, 2012
Sold by
Moore Bonnie J
Bought by
Moore Bonnie J and The Bonnie J Moore Trust #1
Current Estimated Value
Home Financials for this Owner
Home Financials are based on the most recent Mortgage that was taken out on this home.
Original Mortgage
$508,500
Outstanding Balance
$492,209
Interest Rate
3.55%
Mortgage Type
Reverse Mortgage Home Equity Conversion Mortgage
Estimated Equity
$86,338
Purchase Details
Closed on
May 11, 2011
Sold by
Moore Bonnie J
Bought by
Moore Bonnie J
Home Financials for this Owner
Home Financials are based on the most recent Mortgage that was taken out on this home.
Original Mortgage
$142,236
Interest Rate
4.91%
Mortgage Type
New Conventional
Purchase Details
Closed on
Feb 1, 2000
Sold by
Moore Bonnie Jo
Bought by
Moore Bonnie Jo Trust and Moore Bonnie J Trust
Purchase Details
Closed on
Jun 4, 1990
Bought by
Moore and Moore Bonnie J Trust
Create a Home Valuation Report for This Property
The Home Valuation Report is an in-depth analysis detailing your home's value as well as a comparison with similar homes in the area
Home Values in the Area
Average Home Value in this Area
Purchase History
| Date | Buyer | Sale Price | Title Company |
|---|---|---|---|
| Moore Bonnie J | -- | None Available | |
| Moore Bonnie J | -- | None Available | |
| Moore Bonnie J | -- | Clearstream Title | |
| Moore Bonnie Jo Trust | -- | -- | |
| Moore | $149,900 | -- |
Source: Public Records
Mortgage History
| Date | Status | Borrower | Loan Amount |
|---|---|---|---|
| Open | Moore Bonnie J | $508,500 | |
| Closed | Moore Bonnie J | $142,236 |
Source: Public Records
Tax History Compared to Growth
Tax History
| Year | Tax Paid | Tax Assessment Tax Assessment Total Assessment is a certain percentage of the fair market value that is determined by local assessors to be the total taxable value of land and additions on the property. | Land | Improvement |
|---|---|---|---|---|
| 2025 | $4,069 | $233,000 | $0 | $0 |
| 2024 | $4,069 | $228,100 | $0 | $0 |
| 2023 | $5,901 | $210,900 | $0 | $0 |
| 2022 | $5,717 | $211,400 | $0 | $0 |
| 2021 | $5,498 | $194,400 | $0 | $0 |
| 2020 | $3,632 | $182,700 | $0 | $0 |
| 2019 | $5,239 | $197,900 | $0 | $0 |
| 2018 | $5,187 | $189,400 | $0 | $0 |
| 2017 | $5,191 | $167,200 | $0 | $0 |
| 2016 | $4,985 | $161,300 | $0 | $0 |
| 2015 | -- | $161,300 | $0 | $0 |
| 2013 | -- | $152,800 | $0 | $0 |
Source: Public Records
Map
Nearby Homes
- 1000 Ada Place Dr SE
- 804 Meadowmeade Dr SE
- 4972 Luxemburg St SE Unit 8
- 645 Abbey Mill Dr SE
- 5479 Ada Dr SE
- 868 Bridge Walk Ct SE Unit 85
- 495 W Abbey Mill Dr SE
- 5656 Highbury Dr SE Unit 261
- 1145 Eastmont Dr SE
- 320 Sycamore Way Dr SE Unit 18
- 1598 MacNider Ave SE
- 4519 Thornberry Dr SE Unit 26
- 616 Saint Andrews Ct SE
- 1150 Farnsworth Ave SE
- 1674 Riva Ridge Dr SE
- 77 Landall Ln SE
- 4343 Saint Andrews St SE
- 6040 Adacroft Dr SE
- VL/60 Ada Hills Dr
- 60 Ada Hills Dr
- 749 W Woodmeade Ct SE
- 759 W Woodmeade Ct SE
- 729 W Woodmeade Ct SE
- 744 W Woodmeade Ct SE
- 728 W Woodmeade Ct SE
- 760 W Woodmeade Ct SE
- 760 E Woodmeade Ct SE
- 771 W Woodmeade Ct SE
- 719 W Woodmeade Ct SE
- 772 E Woodmeade Ct SE
- 772 W Woodmeade Ct SE
- 714 W Woodmeade Ct SE
- 785 W Woodmeade Ct SE
- 711 W Woodmeade Ct SE
- 869 Spaulding Ave SE
- 869 Spaulding Ave Ave SE
- 850 Byerly Ave SE
- 890 Byerly Ave SE
- 843 Spaulding Ave SE
- 784 W Woodmeade Ct SE