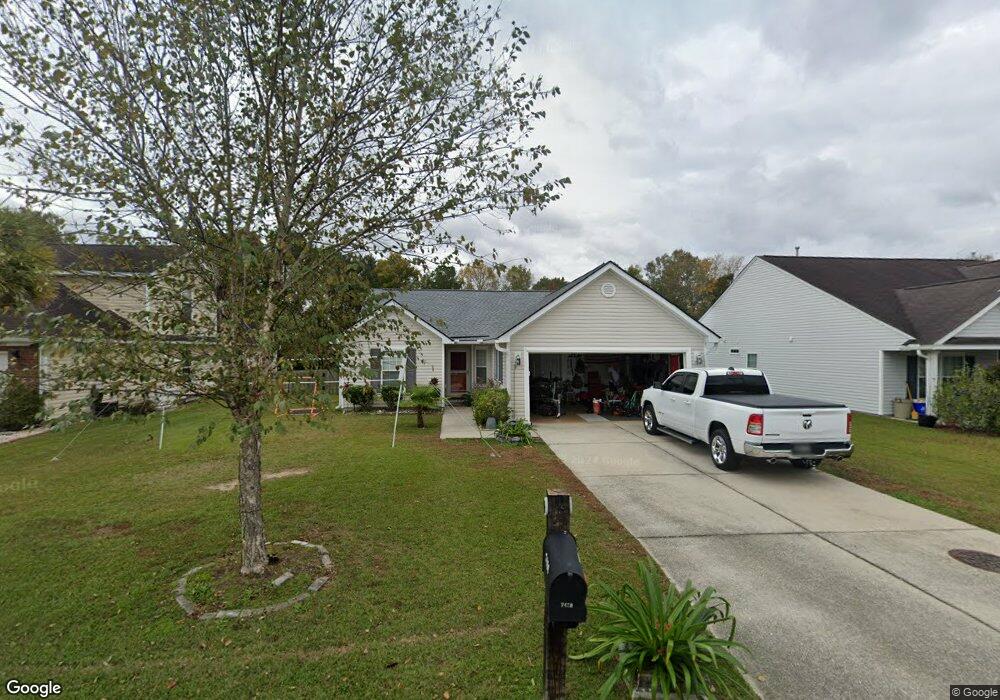
7430 Painted Bunting Way Hanahan, SC 29410
Estimated Value: $359,564 - $398,000
3
Beds
2
Baths
1,287
Sq Ft
$297/Sq Ft
Est. Value
About This Home
This home is located at 7430 Painted Bunting Way, Hanahan, SC 29410 and is currently estimated at $382,141, approximately $296 per square foot. 7430 Painted Bunting Way is a home located in Berkeley County with nearby schools including Bowen's Corner Elementary, Hanahan Middle School, and Hanahan High School.
Ownership History
Date
Name
Owned For
Owner Type
Purchase Details
Closed on
Mar 31, 2008
Sold by
Henderson James A and Henderson Jennell E
Bought by
Gibson James Lawrence
Current Estimated Value
Home Financials for this Owner
Home Financials are based on the most recent Mortgage that was taken out on this home.
Original Mortgage
$181,394
Outstanding Balance
$114,906
Interest Rate
5.97%
Mortgage Type
VA
Estimated Equity
$267,235
Purchase Details
Closed on
Aug 25, 2006
Sold by
Ryland Group Inc
Bought by
Henderson James A and Henderson Jennell E
Home Financials for this Owner
Home Financials are based on the most recent Mortgage that was taken out on this home.
Original Mortgage
$148,804
Interest Rate
6.67%
Mortgage Type
Future Advance Clause Open End Mortgage
Purchase Details
Closed on
Apr 18, 2006
Sold by
Charleston Brown Co Llc
Bought by
The Ryland Group Inc
Create a Home Valuation Report for This Property
The Home Valuation Report is an in-depth analysis detailing your home's value as well as a comparison with similar homes in the area
Home Values in the Area
Average Home Value in this Area
Purchase History
| Date | Buyer | Sale Price | Title Company |
|---|---|---|---|
| Gibson James Lawrence | $175,600 | Attorney | |
| Henderson James A | $186,005 | None Available | |
| The Ryland Group Inc | $192,275 | None Available |
Source: Public Records
Mortgage History
| Date | Status | Borrower | Loan Amount |
|---|---|---|---|
| Open | Gibson James Lawrence | $181,394 | |
| Previous Owner | Henderson James A | $148,804 |
Source: Public Records
Tax History Compared to Growth
Tax History
| Year | Tax Paid | Tax Assessment Tax Assessment Total Assessment is a certain percentage of the fair market value that is determined by local assessors to be the total taxable value of land and additions on the property. | Land | Improvement |
|---|---|---|---|---|
| 2025 | $111 | $202,343 | $53,735 | $148,608 |
| 2024 | $111 | $8,093 | $2,149 | $5,944 |
| 2023 | $111 | $8,093 | $2,149 | $5,944 |
| 2022 | $111 | $7,038 | $1,762 | $5,276 |
| 2021 | $111 | $7,040 | $1,762 | $5,276 |
| 2020 | $111 | $7,038 | $1,762 | $5,276 |
| 2019 | $111 | $7,038 | $1,762 | $5,276 |
| 2018 | $111 | $6,120 | $1,840 | $4,280 |
| 2017 | $111 | $6,120 | $1,840 | $4,280 |
| 2016 | $111 | $6,120 | $1,840 | $4,280 |
| 2015 | $111 | $6,120 | $1,840 | $4,280 |
| 2014 | $826 | $6,120 | $1,840 | $4,280 |
| 2013 | -- | $6,120 | $1,840 | $4,280 |
Source: Public Records
Map
Nearby Homes
- 1333 Song Sparrow Way
- 7402 Purser Ln
- 7406 Mercedes Way
- 7326 Kestrel Trail
- 7434 Northgate Dr
- 7315 Kestrel Trail
- 7303 Kestrel Trail
- 7317 Horned Grebe Ct
- 7304 Kestrel Trail
- 7358 Suncatcher Dr
- 7316 Water Thrush Ct
- 1038 Old Cypress Run
- 7316 Stoney Moss Way
- 7532 Hawks Cir
- 202 Waterwood Dr Unit 2302
- 605 Waterwood Dr Unit 1505
- 607 Waterwood Dr
- 201 Greenmeadow Dr
- 202 Greenmeadow Dr
- 1005 Waterwood Dr
- 7432 Painted Bunting Way
- 7428 Painted Bunting Way
- 7434 Painted Bunting Way
- 1402 Red Knot Ct
- 7433 Painted Bunting Way
- 7436 Painted Bunting Way
- 7424 Painted Bunting Way
- 7437 Painted Bunting Way
- 1404 Red Knot Ct
- 7438 Painted Bunting Way
- 7422 Painted Bunting Way
- 1407 Rock Dove Ln
- 7441 Painted Bunting Way
- 1406 Red Knot Ct
- 1402 Grackle Ct
- 1405 Rock Dove Ln
- 7440 Painted Bunting Way
- 7420 Painted Bunting Way
- 1404 Grackle Ct
- 1403 Rock Dove Ln