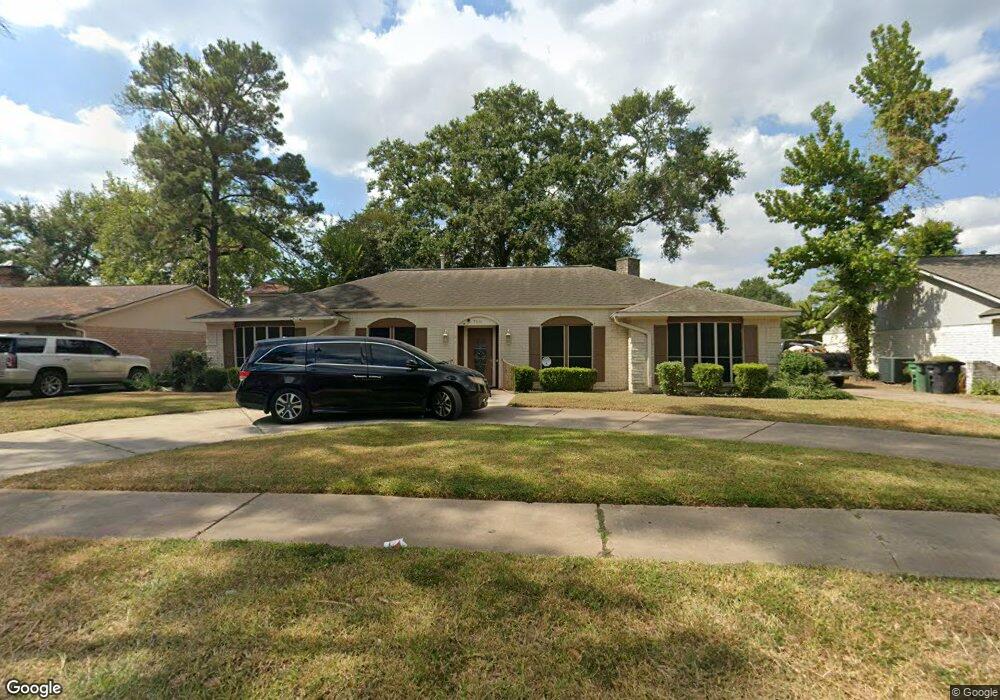
7431 Antoine Dr Houston, TX 77088
Greater Inwood NeighborhoodEstimated Value: $230,000 - $274,000
3
Beds
2
Baths
2,607
Sq Ft
$100/Sq Ft
Est. Value
About This Home
This home is located at 7431 Antoine Dr, Houston, TX 77088 and is currently estimated at $259,861, approximately $99 per square foot. 7431 Antoine Dr is a home located in Harris County with nearby schools including Edward a Vines EC/Pre-K/K School, J. Ruth Smith Elementary, and Hoffman Middle School.
Ownership History
Date
Name
Owned For
Owner Type
Purchase Details
Closed on
Feb 3, 2015
Sold by
Hodge Diane Gunter
Bought by
Wilson Charles and Wilson Shanta Reed
Current Estimated Value
Home Financials for this Owner
Home Financials are based on the most recent Mortgage that was taken out on this home.
Original Mortgage
$80,000
Outstanding Balance
$27,426
Interest Rate
3.78%
Mortgage Type
New Conventional
Estimated Equity
$232,435
Purchase Details
Closed on
Jun 13, 2012
Sold by
Bank Of New York Mellon
Bought by
Hodge Diane Gunter
Purchase Details
Closed on
Nov 21, 2011
Sold by
Boice Jerry
Bought by
The Bank Of New York Mellon and The Bank Of New York
Purchase Details
Closed on
May 14, 2004
Sold by
Edmiston Norman D
Bought by
Boice Jerry
Home Financials for this Owner
Home Financials are based on the most recent Mortgage that was taken out on this home.
Original Mortgage
$100,000
Interest Rate
5.81%
Mortgage Type
Purchase Money Mortgage
Create a Home Valuation Report for This Property
The Home Valuation Report is an in-depth analysis detailing your home's value as well as a comparison with similar homes in the area
Home Values in the Area
Average Home Value in this Area
Purchase History
| Date | Buyer | Sale Price | Title Company |
|---|---|---|---|
| Wilson Charles | -- | American Title Co | |
| Hodge Diane Gunter | -- | Lsi Titel Agency Inc | |
| The Bank Of New York Mellon | $78,660 | None Available | |
| Boice Jerry | -- | Startex 07 Title Company |
Source: Public Records
Mortgage History
| Date | Status | Borrower | Loan Amount |
|---|---|---|---|
| Open | Wilson Charles | $80,000 | |
| Previous Owner | Boice Jerry | $100,000 |
Source: Public Records
Tax History Compared to Growth
Tax History
| Year | Tax Paid | Tax Assessment Tax Assessment Total Assessment is a certain percentage of the fair market value that is determined by local assessors to be the total taxable value of land and additions on the property. | Land | Improvement |
|---|---|---|---|---|
| 2025 | $5,377 | $228,600 | $34,138 | $194,462 |
| 2024 | $5,377 | $236,917 | $34,138 | $202,779 |
| 2023 | $5,377 | $236,917 | $34,138 | $202,779 |
| 2022 | $5,568 | $232,113 | $34,138 | $197,975 |
| 2021 | $5,050 | $201,037 | $17,923 | $183,114 |
| 2020 | $4,769 | $180,689 | $17,923 | $162,766 |
| 2019 | $4,755 | $171,850 | $17,923 | $153,927 |
| 2018 | $2,262 | $157,530 | $17,923 | $139,607 |
| 2017 | $4,179 | $157,530 | $17,923 | $139,607 |
| 2016 | $3,570 | $134,583 | $17,923 | $116,660 |
| 2015 | $2,368 | $134,583 | $17,923 | $116,660 |
| 2014 | $2,368 | $122,038 | $17,923 | $104,115 |
Source: Public Records
Map
Nearby Homes
- 7526 Antoine Dr
- 5907 Darkwood Dr
- 0 Maple Hill Dr
- 4444 Victory Dr Unit 1311
- 4444 Victory Dr Unit 1108
- 5906 Lawn Ln
- 5710 Council Grove Ln
- 5914 Lawn Ln
- 5639 Council Grove Ln
- 5606 Water Leaf Ln
- 7211 Deep Forest Dr
- 5514 Long Creek Ln
- 6918 Bent Branch Dr
- 7014 Bent Branch Dr
- 5519 Council Grove Ln
- 4306 Saratoga Dr
- 4206 Saratoga Dr
- 7728 Challie Ln
- 7606 Victory Dr
- 6202 Wagonwheel Cir
- 7427 Antoine Dr
- 7435 Antoine Dr
- 7423 Antoine Dr
- 7439 Antoine Dr
- 7430 Antoine Dr
- 7419 Antoine Dr
- 7426 Antoine Dr
- 7434 Antoine Dr
- 7503 Antoine Dr
- 7422 Antoine Dr
- 7438 Antoine Dr
- 7415 Antoine Dr
- 7507 Antoine Dr
- 7502 Antoine Dr
- 7418 Antoine Dr
- 7434 Deep Forest Dr
- 7438 Deep Forest Dr
- 7430 Deep Forest Dr
- 7442 Deep Forest Dr
- 7426 Deep Forest Dr