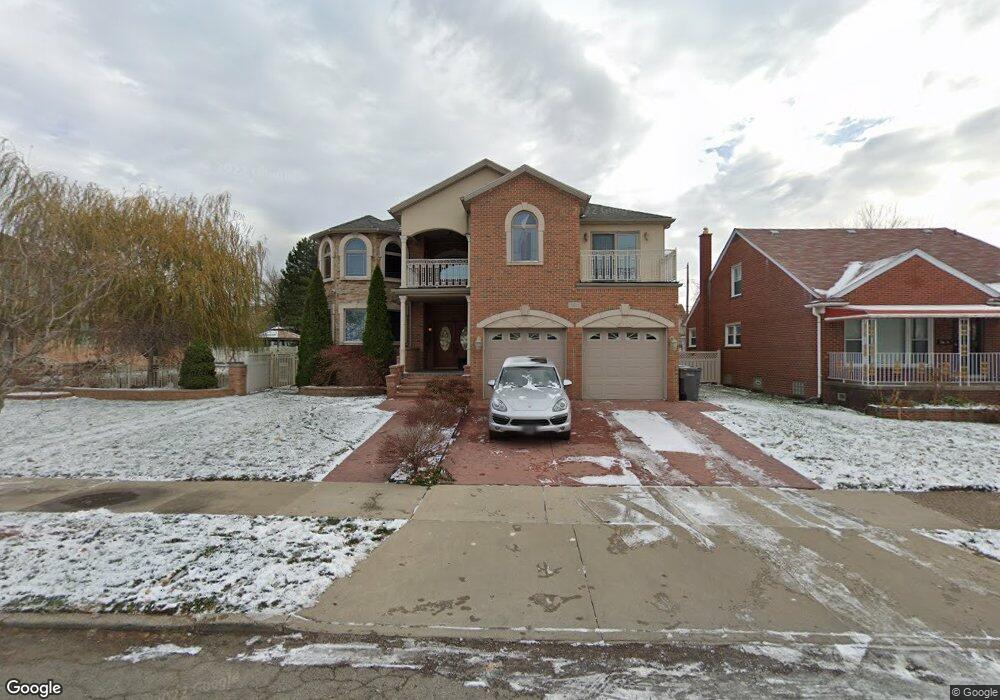
7432 Horger St Dearborn, MI 48126
Oakman Grove NeighborhoodEstimated Value: $251,000 - $719,000
4
Beds
3
Baths
3,655
Sq Ft
$143/Sq Ft
Est. Value
About This Home
This home is located at 7432 Horger St, Dearborn, MI 48126 and is currently estimated at $521,215, approximately $142 per square foot. 7432 Horger St is a home located in Wayne County with nearby schools including McCollough-Unis School, Fordson High School, and Riverside Academy - West Campus.
Ownership History
Date
Name
Owned For
Owner Type
Purchase Details
Closed on
Apr 2, 2022
Sold by
Bazzi and Maya
Bought by
Bazzi Mohamad and Bazzi Hassan
Current Estimated Value
Purchase Details
Closed on
May 30, 2007
Sold by
Mustapha Adam and Mustapha Nawal
Bought by
Bazzi Mohamad
Purchase Details
Closed on
Mar 1, 2005
Sold by
Safieddine Islam Khomeini
Bought by
Mustapha Adam
Purchase Details
Closed on
Sep 23, 2003
Sold by
Edriss Talib and Edriss Wijdan
Bought by
Safieddine Islam Khomeini
Purchase Details
Closed on
Mar 5, 2003
Sold by
Abn Amro Mortgage Group Inc
Bought by
Perfection Home Building
Purchase Details
Closed on
Feb 20, 2002
Sold by
Hamid Al Adijien
Bought by
Abn Amro Mtg Group Inc
Purchase Details
Closed on
May 11, 2001
Sold by
Alwashah Alaa
Bought by
Hamid Al Dijien
Purchase Details
Closed on
May 23, 1996
Sold by
Alwashah Alaa
Bought by
Amine Nagham
Purchase Details
Closed on
Apr 17, 1996
Sold by
Amine Nagham
Bought by
Guest David B and Guest Katherine
Create a Home Valuation Report for This Property
The Home Valuation Report is an in-depth analysis detailing your home's value as well as a comparison with similar homes in the area
Home Values in the Area
Average Home Value in this Area
Purchase History
| Date | Buyer | Sale Price | Title Company |
|---|---|---|---|
| Bazzi Mohamad | -- | Michigan Title Insurance Agenc | |
| Bazzi Mohamad | $75,000 | Multiple | |
| Mustapha Adam | $40,000 | Multiple | |
| Safieddine Islam Khomeini | $36,000 | Multiple | |
| Perfection Home Building | $10,000 | Metropolitan Title | |
| Abn Amro Mtg Group Inc | $147,589 | -- | |
| Hamid Al Dijien | $140,000 | -- | |
| Amine Nagham | $82,000 | -- | |
| Guest David B | $72,000 | -- |
Source: Public Records
Tax History Compared to Growth
Tax History
| Year | Tax Paid | Tax Assessment Tax Assessment Total Assessment is a certain percentage of the fair market value that is determined by local assessors to be the total taxable value of land and additions on the property. | Land | Improvement |
|---|---|---|---|---|
| 2025 | $6,728 | $374,200 | $0 | $0 |
| 2024 | $6,728 | $313,100 | $0 | $0 |
| 2023 | $6,367 | $277,700 | $0 | $0 |
| 2022 | $7,164 | $259,200 | $0 | $0 |
| 2021 | $8,325 | $240,300 | $0 | $0 |
| 2019 | $8,240 | $209,000 | $0 | $0 |
| 2018 | $6,983 | $165,900 | $0 | $0 |
| 2017 | $2,002 | $154,500 | $0 | $0 |
| 2016 | $6,530 | $148,000 | $0 | $0 |
| 2015 | $12,341 | $135,450 | $0 | $0 |
| 2013 | $11,955 | $119,550 | $0 | $0 |
| 2011 | -- | $131,400 | $0 | $0 |
Source: Public Records
Map
Nearby Homes
- 7247 Middlesex St
- 7241 Middlesex St
- 7542 Neckel St
- 7444 Kendal St
- 7457 Kendal St
- 7813 Neckel St
- 3 Morross Ct
- 7308 Orchard Ave
- 6855 Calhoun St
- 7750 Morross Ct
- 7261 Reuter St
- 7716 W Morrow Cir
- 7927 Bingham St
- 7309 Ternes
- 6852 Jonathon St
- 7910 Orchard Ave
- 7857 Esper Blvd
- 7115 Steadman St
- 8066 Marlowe St
- 6932 Mead St