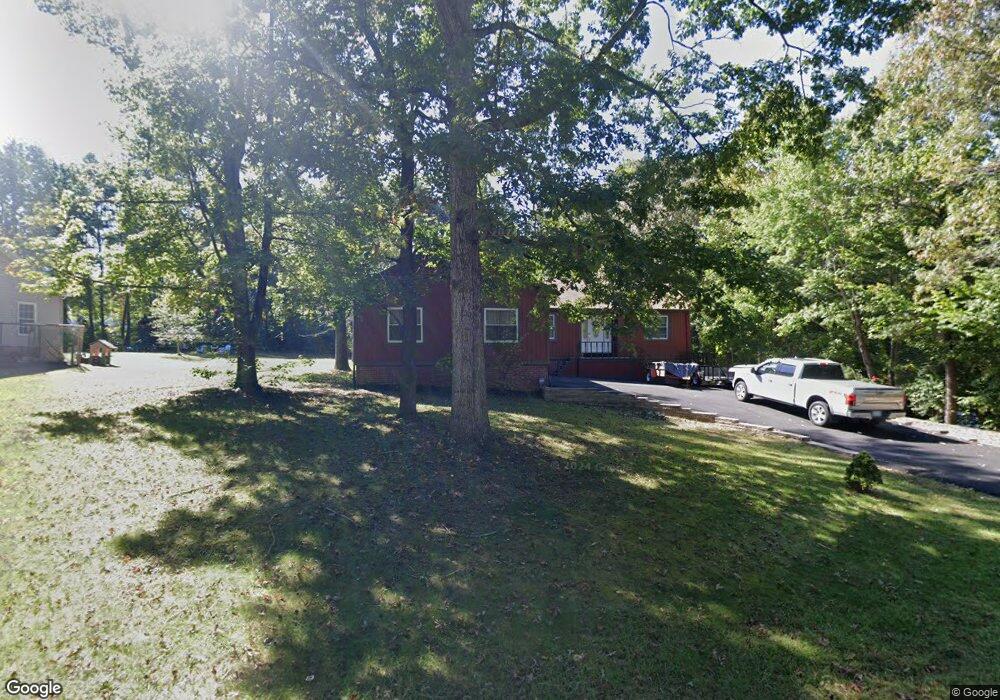
7434 Harrison Dr King George, VA 22485
Estimated Value: $380,000 - $423,000
3
Beds
2
Baths
1,556
Sq Ft
$258/Sq Ft
Est. Value
About This Home
This home is located at 7434 Harrison Dr, King George, VA 22485 and is currently estimated at $401,532, approximately $258 per square foot. 7434 Harrison Dr is a home located in King George County with nearby schools including King George Elementary School, King George Middle School, and King George High School.
Ownership History
Date
Name
Owned For
Owner Type
Purchase Details
Closed on
Dec 21, 2017
Sold by
Polack Scott G
Bought by
Polack Scott G and The Scott G Polack Trust Dated December
Current Estimated Value
Purchase Details
Closed on
Feb 29, 2008
Sold by
Kirkpatrick John
Bought by
Polack Scott
Home Financials for this Owner
Home Financials are based on the most recent Mortgage that was taken out on this home.
Original Mortgage
$199,200
Outstanding Balance
$124,498
Interest Rate
5.8%
Mortgage Type
New Conventional
Estimated Equity
$277,034
Purchase Details
Closed on
Dec 16, 2002
Sold by
Shafferman David C
Bought by
Kirkpatrick John D
Home Financials for this Owner
Home Financials are based on the most recent Mortgage that was taken out on this home.
Original Mortgage
$145,255
Interest Rate
6.17%
Mortgage Type
New Conventional
Create a Home Valuation Report for This Property
The Home Valuation Report is an in-depth analysis detailing your home's value as well as a comparison with similar homes in the area
Home Values in the Area
Average Home Value in this Area
Purchase History
| Date | Buyer | Sale Price | Title Company |
|---|---|---|---|
| Polack Scott G | -- | None Available | |
| Polack Scott | $249,900 | -- | |
| Kirkpatrick John D | $152,900 | -- |
Source: Public Records
Mortgage History
| Date | Status | Borrower | Loan Amount |
|---|---|---|---|
| Open | Polack Scott | $199,200 | |
| Previous Owner | Kirkpatrick John D | $145,255 |
Source: Public Records
Tax History Compared to Growth
Tax History
| Year | Tax Paid | Tax Assessment Tax Assessment Total Assessment is a certain percentage of the fair market value that is determined by local assessors to be the total taxable value of land and additions on the property. | Land | Improvement |
|---|---|---|---|---|
| 2025 | $2,250 | $330,900 | $60,000 | $270,900 |
| 2024 | $2,250 | $330,900 | $60,000 | $270,900 |
| 2023 | $2,250 | $330,900 | $60,000 | $270,900 |
| 2022 | $2,118 | $330,900 | $60,000 | $270,900 |
| 2021 | $1,826 | $250,200 | $51,000 | $199,200 |
| 2020 | $1,700 | $242,800 | $51,000 | $191,800 |
| 2019 | $1,700 | $242,800 | $51,000 | $191,800 |
| 2018 | $1,700 | $242,800 | $51,000 | $191,800 |
| 2017 | $1,583 | $226,100 | $51,000 | $175,100 |
| 2016 | $1,537 | $226,100 | $51,000 | $175,100 |
| 2015 | -- | $226,100 | $51,000 | $175,100 |
| 2014 | -- | $226,100 | $51,000 | $175,100 |
Source: Public Records
Map
Nearby Homes
- 7504 Cleveland Dr
- 8008 Washington Dr
- 0 Jefferson Dr Unit VAKG2006130
- 7369 Buchanan Dr
- 7224 Washington Dr
- 9397 Inaugural Dr
- 0 Dahlgren Rd
- 8339 Kennedy Dr
- 10468 Johnson Dr
- Lot 19 Roosevelt Dr
- 6615 Stanley Rd
- 0 Kings Hwy Unit VAKG2003792
- 0 Kings Hwy Unit VAKG2002766
- 0 Kings Hwy Unit VAKG2006132
- 9028 Saint Anthonys Rd
- 6025 Winston Place
- Spencer Plan at Indiantown Rd
- Patricia Plan at Indiantown Rd
- Shenandoah Plan at Indiantown Rd
- Chadwick Plan at Indiantown Rd
- 7442 Harrison Dr
- 10188 Madison Dr
- 7428 Harrison Dr
- 0 Harrison Dr
- Lot 22 Madison Dr
- 7431 Harrison Dr
- 7445 Harrison Dr
- 7421 Taft Ct
- 0 Lot 93 Harrison Dr Unit KG6559861
- 0 Harrison Dr Unit 1007866408
- 0 Harrison Dr Unit 1000050173
- 0 Harrison Dr Unit 1007610396
- 0 Harrison Dr Unit 1003745687
- 0 Harrison Dr Unit 1007225778
- 0 Harrison Dr Unit 1007158402
- 0 Harrison Dr Unit 1006975722
- 0 Harrison Dr Unit 1006750454
- 0 Harrison Dr Unit 1006740552
- 0 Harrison Dr Unit 1006512972
- 0 Harrison Dr Unit 1006448558