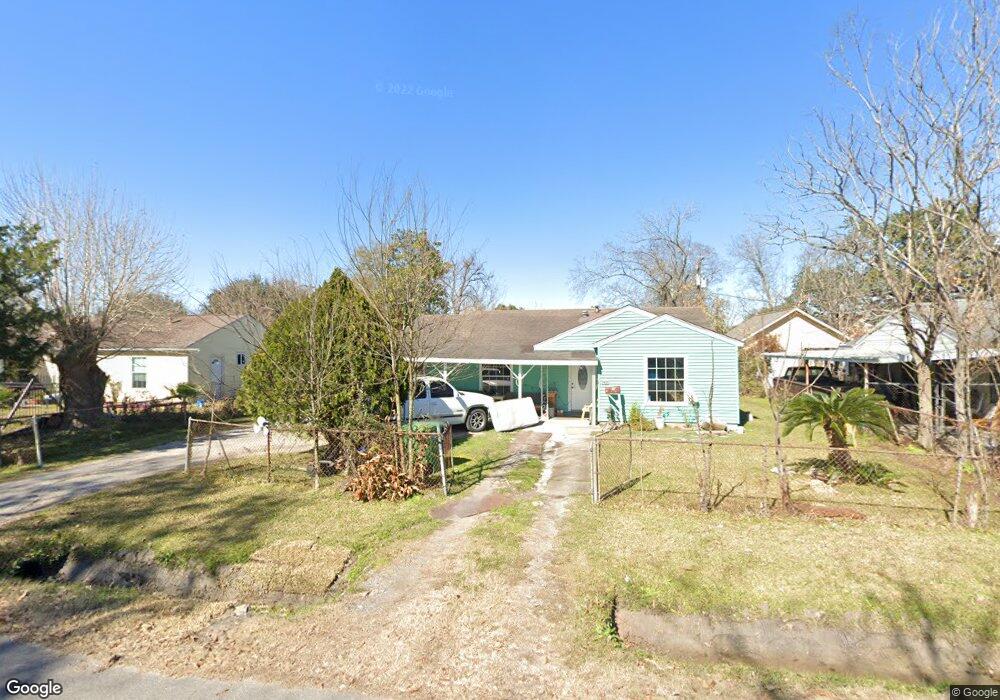
7435 Bradford St Houston, TX 77087
Golfcrest-Bellfort-Reveille NeighborhoodEstimated Value: $190,000 - $223,000
3
Beds
1
Bath
1,177
Sq Ft
$171/Sq Ft
Est. Value
About This Home
This home is located at 7435 Bradford St, Houston, TX 77087 and is currently estimated at $201,632, approximately $171 per square foot. 7435 Bradford St is a home located in Harris County with nearby schools including Golfcrest Elementary School, Hartman Middle School, and Ross Shaw Sterling Aviation High School.
Ownership History
Date
Name
Owned For
Owner Type
Purchase Details
Closed on
Jun 29, 2018
Sold by
Rivas Roberto
Bought by
Rivas Roberto and Rivas Blance M
Current Estimated Value
Purchase Details
Closed on
Dec 29, 2010
Sold by
Bank Of America National Association
Bought by
Rivas Roberto
Purchase Details
Closed on
Feb 2, 2010
Sold by
Molina Maria and Molina Daniel
Bought by
Bank Of America National Association
Purchase Details
Closed on
Jun 27, 2006
Sold by
Molina Daniel
Bought by
Molina Maria
Purchase Details
Closed on
Apr 18, 1994
Sold by
Nixon Walter C and Nixon Mary Clare
Bought by
Molina Daniel
Home Financials for this Owner
Home Financials are based on the most recent Mortgage that was taken out on this home.
Original Mortgage
$35,150
Interest Rate
7.61%
Create a Home Valuation Report for This Property
The Home Valuation Report is an in-depth analysis detailing your home's value as well as a comparison with similar homes in the area
Home Values in the Area
Average Home Value in this Area
Purchase History
| Date | Buyer | Sale Price | Title Company |
|---|---|---|---|
| Rivas Roberto | -- | None Available | |
| Rivas Roberto | -- | Lsi Title Agency Inc | |
| Bank Of America National Association | $54,375 | None Available | |
| Molina Maria | -- | None Available | |
| Molina Daniel | -- | -- |
Source: Public Records
Mortgage History
| Date | Status | Borrower | Loan Amount |
|---|---|---|---|
| Previous Owner | Molina Daniel | $35,150 |
Source: Public Records
Tax History Compared to Growth
Tax History
| Year | Tax Paid | Tax Assessment Tax Assessment Total Assessment is a certain percentage of the fair market value that is determined by local assessors to be the total taxable value of land and additions on the property. | Land | Improvement |
|---|---|---|---|---|
| 2025 | $18 | $217,213 | $69,400 | $147,813 |
| 2024 | $18 | $208,538 | $60,725 | $147,813 |
| 2023 | $18 | $208,538 | $60,725 | $147,813 |
| 2022 | $3,380 | $197,239 | $60,725 | $136,514 |
| 2021 | $3,253 | $159,980 | $34,700 | $125,280 |
| 2020 | $3,073 | $126,881 | $21,688 | $105,193 |
| 2019 | $2,975 | $117,561 | $21,688 | $95,873 |
| 2018 | $1,817 | $104,120 | $21,688 | $82,432 |
| 2017 | $2,633 | $104,120 | $21,688 | $82,432 |
| 2016 | $2,555 | $101,056 | $21,688 | $79,368 |
| 2015 | $1,571 | $95,957 | $19,519 | $76,438 |
| 2014 | $1,571 | $84,697 | $19,519 | $65,178 |
Source: Public Records
Map
Nearby Homes
- 3731 Reveille St
- 7507 Greenstone St
- 7543 Greenstone St
- 7546 Greendowns St
- 7393 Fairway Dr Unit B
- 7659 Greenstone St
- 7337 Moline St
- 7309 Moline St
- 7703 Mchenry St
- 7318 Thurow St
- 3607 De Leon St
- 7734 El Rancho St
- 6023 Winterhaven Dr
- 7735 Oak Vista St
- 7758 Hereford St
- 3408 Chaffin St
- 7486 Stanwick Dr
- 7937 Grafton St
- 0 Dover St Unit 39828065
- 7909 Dixie Dr
- 7501 Bradford St
- 7429 Bradford St
- 7505 Bradford St
- 7425 Bradford St
- 7430 Joplin St
- 7502 Joplin St
- 7426 Joplin St
- 7434 Bradford St
- 7508 Joplin St
- 7422 Joplin St
- 7502 Bradford St
- 7430 Bradford St
- 7509 Bradford St
- 7419 Bradford St
- 7506 Bradford St
- 7426 Bradford St
- 7418 Joplin St
- 7512 Joplin St
- 7513 Bradford St
- 7415 Bradford St