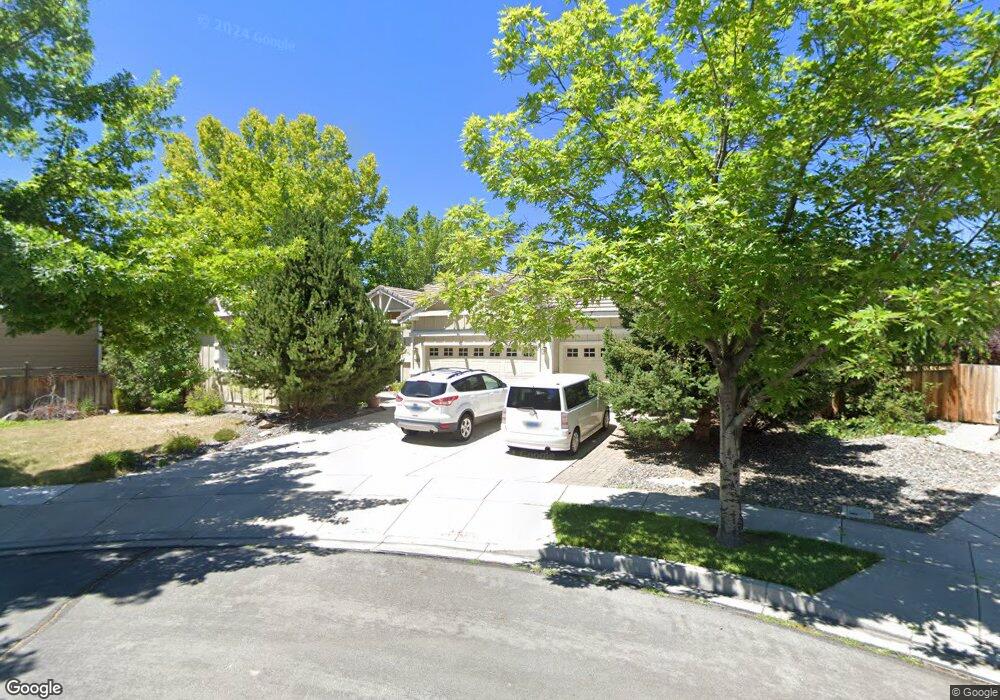
7435 Little Easy Ct Unit 13A Sparks, NV 89436
Wingfield Springs NeighborhoodEstimated Value: $608,000 - $667,000
4
Beds
2
Baths
1,981
Sq Ft
$322/Sq Ft
Est. Value
About This Home
This home is located at 7435 Little Easy Ct Unit 13A, Sparks, NV 89436 and is currently estimated at $636,972, approximately $321 per square foot. 7435 Little Easy Ct Unit 13A is a home located in Washoe County with nearby schools including Van Gorder Elementary School, Sky Ranch Middle School, and Spanish Springs High School.
Ownership History
Date
Name
Owned For
Owner Type
Purchase Details
Closed on
Jun 29, 2021
Sold by
Cassidy Elizabeth and Cassidy Daniel C
Bought by
Cassidy Daniel C and Cassidy Elizabeth Smyth
Current Estimated Value
Purchase Details
Closed on
Oct 28, 2003
Sold by
Ziegler Bruce E and Ziegler Ruth A
Bought by
Cassidy Daniel C and Cassidy Elizabeth
Home Financials for this Owner
Home Financials are based on the most recent Mortgage that was taken out on this home.
Original Mortgage
$235,600
Outstanding Balance
$107,095
Interest Rate
5.72%
Mortgage Type
Unknown
Estimated Equity
$529,877
Purchase Details
Closed on
Nov 25, 1998
Sold by
Silverado 140 Lp
Bought by
Ziegler Bruce E and Ziegler Ruth A
Home Financials for this Owner
Home Financials are based on the most recent Mortgage that was taken out on this home.
Original Mortgage
$141,500
Interest Rate
6.84%
Create a Home Valuation Report for This Property
The Home Valuation Report is an in-depth analysis detailing your home's value as well as a comparison with similar homes in the area
Home Values in the Area
Average Home Value in this Area
Purchase History
| Date | Buyer | Sale Price | Title Company |
|---|---|---|---|
| Cassidy Daniel C | -- | None Available | |
| Cassidy Daniel C | $804,966 | First American Title | |
| Ziegler Bruce E | $228,000 | First American Title Co |
Source: Public Records
Mortgage History
| Date | Status | Borrower | Loan Amount |
|---|---|---|---|
| Open | Cassidy Daniel C | $235,600 | |
| Previous Owner | Ziegler Bruce E | $141,500 |
Source: Public Records
Tax History Compared to Growth
Tax History
| Year | Tax Paid | Tax Assessment Tax Assessment Total Assessment is a certain percentage of the fair market value that is determined by local assessors to be the total taxable value of land and additions on the property. | Land | Improvement |
|---|---|---|---|---|
| 2025 | $2,991 | $143,401 | $46,375 | $97,026 |
| 2024 | $2,991 | $136,349 | $38,290 | $98,059 |
| 2023 | $2,918 | $130,483 | $38,850 | $91,633 |
| 2022 | $2,825 | $109,370 | $32,060 | $77,310 |
| 2021 | $2,744 | $106,065 | $28,350 | $77,715 |
| 2020 | $2,659 | $107,974 | $29,470 | $78,504 |
| 2019 | $2,586 | $104,274 | $27,615 | $76,659 |
| 2018 | $2,508 | $94,985 | $19,845 | $75,140 |
| 2017 | $2,436 | $94,003 | $18,655 | $75,348 |
| 2016 | $2,373 | $95,124 | $17,675 | $77,449 |
| 2015 | $2,375 | $86,004 | $15,400 | $70,604 |
| 2014 | $2,304 | $75,357 | $13,195 | $62,162 |
| 2013 | -- | $58,827 | $10,710 | $48,117 |
Source: Public Records
Map
Nearby Homes
- 7476 Lorna Ln
- 7430 Earlsmoore Dr
- 7330 Little Easy St
- 2850 Billie Dove Ct
- 7420 Island Queen Dr
- 2608 Arrow Smith Dr Unit 13B
- 7302 Little Easy St
- 2880 Friar Rock Ct
- 2850 Friar Rock Ct
- 2861 Friar Rock Ct
- 2691 Sutter Butte Ct
- 7511 Hoback Dr
- 7511 Hoback Dr Unit Windsong 54
- 7415 Hoback Dr
- 7523 Hoback Dr
- 2457 Newberry Ct Unit Oakhill 102
- 2880 Thistle Belle Ct
- 2386 Newberry Way
- 2376 Newberry Way
- 7436 Rustic Towers Dr
- 7425 Little Easy Ct
- 7445 Little Easy Ct
- 7444 Little Easy Ct
- 7415 Little Easy Ct
- 2710 Chaucer St Unit 13A
- 7450 Lorna Ln
- 7440 Lorna Ln
- 7458 Lorna Ln
- 7430 Lorna Ln
- 7436 Little Easy Ct
- 7450 Little Easy Ct
- 7430 Little Easy Ct
- 7405 Little Easy Ct Unit 13A
- 7468 Lorna Ln
- 7422 Lorna Ln
- 7422 Little Easy Ct
- 7412 Lorna Ln
- 7414 Little Easy Ct
- 7404 Lorna Ln
- 7484 Lorna Ln