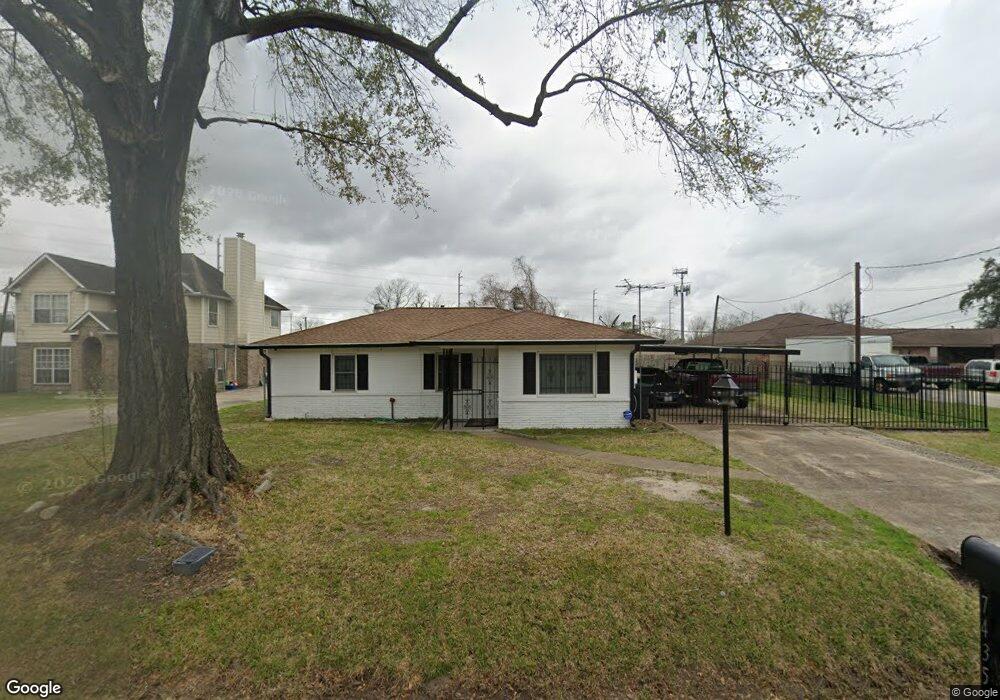
7435 Maxroy St Houston, TX 77088
Acres Homes NeighborhoodEstimated Value: $191,000 - $228,000
2
Beds
1
Bath
1,008
Sq Ft
$206/Sq Ft
Est. Value
About This Home
This home is located at 7435 Maxroy St, Houston, TX 77088 and is currently estimated at $207,225, approximately $205 per square foot. 7435 Maxroy St is a home located in Harris County with nearby schools including Reece Academy, Anderson Academy, and Drew Academy.
Ownership History
Date
Name
Owned For
Owner Type
Purchase Details
Closed on
May 23, 2021
Sold by
Starks Winfrey Vachael
Bought by
Winfrey Byron Glen
Current Estimated Value
Purchase Details
Closed on
Feb 19, 2016
Sold by
Bryant Andrea Winfrey
Bought by
Winfrey Byron Glen
Purchase Details
Closed on
Jan 3, 2002
Sold by
Winfrey Melvin and Winfrey Norvell
Bought by
Bryant Frank J and Bryant Andrea
Purchase Details
Closed on
Apr 9, 2001
Sold by
Winfrey Melvin
Bought by
Bryant Frank
Purchase Details
Closed on
Jun 30, 1999
Sold by
Mattair Van Ngoc and Mattair Charles R
Bought by
Tran Loc and Nguyen Anh
Home Financials for this Owner
Home Financials are based on the most recent Mortgage that was taken out on this home.
Original Mortgage
$60,000
Interest Rate
7%
Mortgage Type
Seller Take Back
Purchase Details
Closed on
Jan 29, 1999
Sold by
Dugas Irvine A and Dugas Eula M
Bought by
Vu Dihn Huu
Purchase Details
Closed on
Jan 30, 1998
Sold by
Delgado Angel and Delgado Romelia
Bought by
Jiminez Sergio Luis
Create a Home Valuation Report for This Property
The Home Valuation Report is an in-depth analysis detailing your home's value as well as a comparison with similar homes in the area
Home Values in the Area
Average Home Value in this Area
Purchase History
| Date | Buyer | Sale Price | Title Company |
|---|---|---|---|
| Winfrey Byron Glen | -- | None Available | |
| Winfrey Byron Glen | -- | None Available | |
| Bryant Frank J | -- | -- | |
| Bryant Frank | -- | -- | |
| Tran Loc | $25,000 | -- | |
| Vu Dihn Huu | -- | Title One | |
| Jiminez Sergio Luis | -- | Regency Title |
Source: Public Records
Mortgage History
| Date | Status | Borrower | Loan Amount |
|---|---|---|---|
| Previous Owner | Tran Loc | $60,000 |
Source: Public Records
Tax History
| Year | Tax Paid | Tax Assessment Tax Assessment Total Assessment is a certain percentage of the fair market value that is determined by local assessors to be the total taxable value of land and additions on the property. | Land | Improvement |
|---|---|---|---|---|
| 2025 | $2,966 | $229,443 | $161,865 | $67,578 |
| 2024 | $2,966 | $223,925 | $168,548 | $55,377 |
| 2023 | $2,966 | $215,449 | $142,560 | $72,889 |
| 2022 | $3,896 | $162,431 | $103,950 | $58,481 |
| 2021 | $3,166 | $126,029 | $74,250 | $51,779 |
| 2020 | $2,435 | $92,237 | $59,400 | $32,837 |
| 2019 | $1,968 | $71,111 | $40,838 | $30,273 |
| 2018 | $888 | $61,846 | $29,700 | $32,146 |
| 2017 | $1,641 | $61,846 | $29,700 | $32,146 |
| 2016 | $1,924 | $72,521 | $26,730 | $45,791 |
| 2015 | $593 | $58,418 | $23,018 | $35,400 |
| 2014 | $593 | $46,095 | $23,018 | $23,077 |
Source: Public Records
Map
Nearby Homes
- 7422 Maxroy St
- 7416 - 7418 Maxroy St
- 8141 W Montgomery
- 0 S Victory Dr Unit 48484102
- 1207 S Victory Dr
- 0 Willow St S
- 0 Willow St St
- 7711 Willow St
- 1926 Dolly Wright St
- 943 Wall St
- 769 Lucky St
- 7818 Hanfro Ln Unit C/D
- 7709 Willow St
- 7704 Sealey St
- 7434 Wheatley St
- 7428 Wheatley St
- 7805 Wheatley St
- TBD Hanfro Ln
- 7303 Wheatley St
- 7229 Wheatley St
- 7433 Maxroy St
- 7443 Maxroy St
- 7434 Maxroy St
- 8104 W Montgomery Rd
- 7424 Maxroy St
- 7438 Maxroy St
- 7509 Maxroy St
- 7440 Maxroy St
- 7418 Maxroy St
- 7416 Maxroy St
- 7512 E Maxroy
- 7414 Maxroy St
- 7520 Maxroy St
- 7516 E Maxroy St
- 7410 Maxroy St
- 7524 Maxroy St
- 7524 E Maxroy St Unit A
- 7524 E Maxroy St
- 8141 Montgomery
- 7402 Maxroy
Your Personal Tour Guide
Ask me questions while you tour the home.