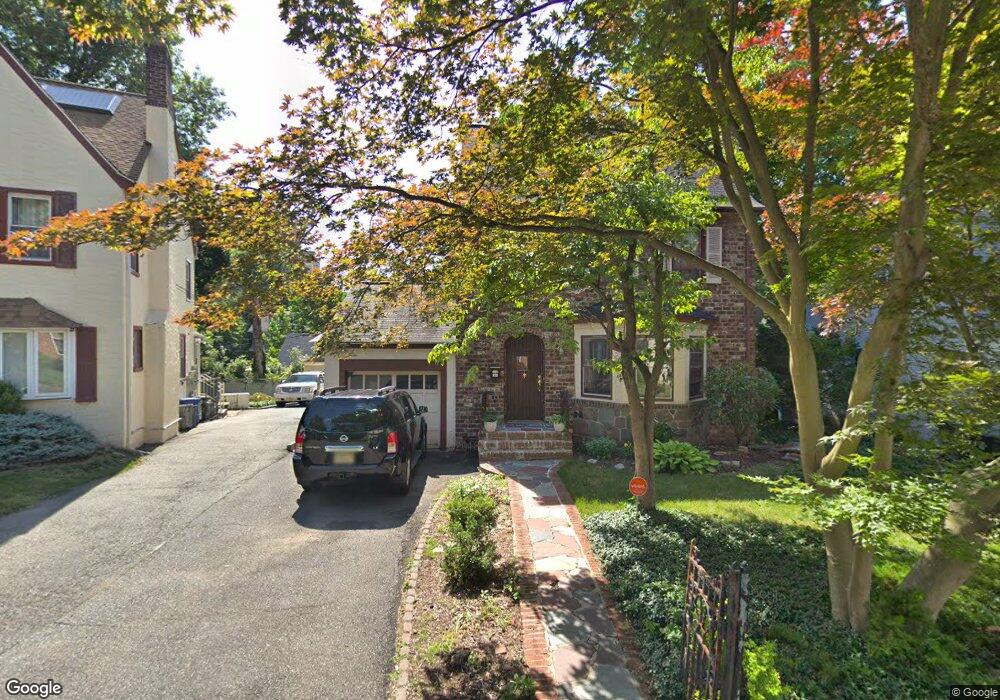
744 E Stirling Dr South Orange, NJ 07079
Estimated Value: $599,000 - $854,000
--
Bed
--
Bath
1,698
Sq Ft
$417/Sq Ft
Est. Value
About This Home
This home is located at 744 E Stirling Dr, South Orange, NJ 07079 and is currently estimated at $708,434, approximately $417 per square foot. 744 E Stirling Dr is a home located in Essex County with nearby schools including Marshall Elementary School, South Orange Middle School, and Columbia Senior High School.
Ownership History
Date
Name
Owned For
Owner Type
Purchase Details
Closed on
Mar 22, 2002
Sold by
Gluck Joseph
Bought by
Barkley Ronald and Barkley Elizabeth
Current Estimated Value
Home Financials for this Owner
Home Financials are based on the most recent Mortgage that was taken out on this home.
Original Mortgage
$267,930
Outstanding Balance
$112,472
Interest Rate
7.13%
Estimated Equity
$595,962
Purchase Details
Closed on
May 14, 1990
Sold by
Gluck Joseph
Bought by
Gluck Joseph and Gluck Babiarz,Mary
Create a Home Valuation Report for This Property
The Home Valuation Report is an in-depth analysis detailing your home's value as well as a comparison with similar homes in the area
Home Values in the Area
Average Home Value in this Area
Purchase History
| Date | Buyer | Sale Price | Title Company |
|---|---|---|---|
| Barkley Ronald | $282,000 | -- | |
| Gluck Joseph | -- | -- |
Source: Public Records
Mortgage History
| Date | Status | Borrower | Loan Amount |
|---|---|---|---|
| Open | Barkley Ronald | $267,930 |
Source: Public Records
Tax History Compared to Growth
Tax History
| Year | Tax Paid | Tax Assessment Tax Assessment Total Assessment is a certain percentage of the fair market value that is determined by local assessors to be the total taxable value of land and additions on the property. | Land | Improvement |
|---|---|---|---|---|
| 2025 | $11,297 | $557,600 | $295,100 | $262,500 |
| 2024 | $11,297 | $557,600 | $295,100 | $262,500 |
| 2022 | $10,893 | $310,600 | $142,600 | $168,000 |
| 2021 | $10,514 | $310,600 | $142,600 | $168,000 |
| 2020 | $10,188 | $310,600 | $142,600 | $168,000 |
| 2019 | $9,933 | $310,600 | $142,600 | $168,000 |
| 2018 | $9,784 | $310,600 | $142,600 | $168,000 |
| 2017 | $9,542 | $310,600 | $142,600 | $168,000 |
| 2016 | $8,173 | $213,500 | $61,800 | $151,700 |
| 2015 | $7,983 | $213,500 | $61,800 | $151,700 |
| 2014 | $7,816 | $213,500 | $61,800 | $151,700 |
Source: Public Records
Map
Nearby Homes
- 510 Finlay Place
- 743 Haxton Ave
- 666 Tremont Ct
- 663 S Center St
- 733 Mosswood Ave
- 281 Beechwood Terrace
- 655 Mosswood Ave
- 129 Holland Rd
- 316 Lawnridge Rd
- 238 Elmwynd Dr
- 251-B Elmwynd Dr
- 335 Tremont Ave
- 295 Tremont Ave
- 72 Elliot Place
- 403 Lawn Ridge Rd
- 403 Lawnridge Rd
- 408 Heywood Ave
- 362 Sanford Ave
- 360 Berwick St
- 1 S Stanley Rd
- 748 E Stirling Dr
- 740 Stirling Dr
- 754 E Stirling Dr
- 171 Stirling Dr N
- 743 E Stirling Dr
- 749 Sterling Dr E
- 749 E Stirling Dr
- 177 Stirling Dr N
- 758 E Stirling Dr
- 759 E Stirling Dr
- 755 E Stirling Dr
- 181 Stirling Dr N
- 745 S Center St
- 399 Stirling Ave
- 759 Sterling Dr E
- 737 S Center St
- 185 Stirling Dr N
- 759 Stirling Dr E
- 168 Heywood Ave
- 746 Stirling Dr