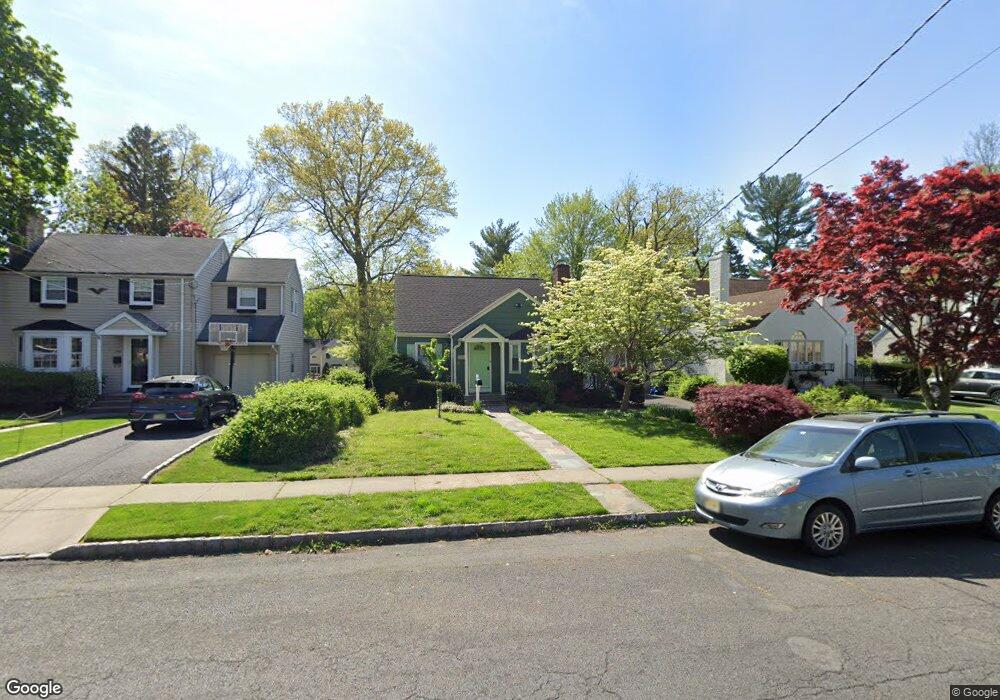
744 Harding St Westfield, NJ 07090
Estimated Value: $1,048,679 - $1,333,000
--
Bed
--
Bath
2,190
Sq Ft
$547/Sq Ft
Est. Value
About This Home
This home is located at 744 Harding St, Westfield, NJ 07090 and is currently estimated at $1,197,420, approximately $546 per square foot. 744 Harding St is a home located in Union County with nearby schools including Washington Elementary School, Edison Intermediate School, and Westfield Senior High School.
Ownership History
Date
Name
Owned For
Owner Type
Purchase Details
Closed on
Aug 9, 2011
Sold by
Romer Gregory
Bought by
Houbanov Jordan and Houbanov Katerina
Current Estimated Value
Purchase Details
Closed on
Aug 20, 2009
Sold by
Romer Gregory and Romer Joanne
Bought by
Romer Gregory
Purchase Details
Closed on
Aug 29, 2001
Sold by
Geary Peter C and Geary Lainie F
Bought by
Romer Gregory and Romer Joanne
Home Financials for this Owner
Home Financials are based on the most recent Mortgage that was taken out on this home.
Original Mortgage
$130,000
Interest Rate
6.99%
Mortgage Type
Credit Line Revolving
Purchase Details
Closed on
Jan 11, 1996
Sold by
Kardias William and Kardias Helen
Bought by
Geary Peter C and Geary Lainie F
Create a Home Valuation Report for This Property
The Home Valuation Report is an in-depth analysis detailing your home's value as well as a comparison with similar homes in the area
Home Values in the Area
Average Home Value in this Area
Purchase History
| Date | Buyer | Sale Price | Title Company |
|---|---|---|---|
| Houbanov Jordan | $575,000 | None Available | |
| Romer Gregory | -- | None Available | |
| Romer Gregory | $390,000 | -- | |
| Geary Peter C | $282,500 | -- |
Source: Public Records
Mortgage History
| Date | Status | Borrower | Loan Amount |
|---|---|---|---|
| Previous Owner | Romer Gregory | $130,000 | |
| Previous Owner | Romer Gregory | $180,000 |
Source: Public Records
Tax History Compared to Growth
Tax History
| Year | Tax Paid | Tax Assessment Tax Assessment Total Assessment is a certain percentage of the fair market value that is determined by local assessors to be the total taxable value of land and additions on the property. | Land | Improvement |
|---|---|---|---|---|
| 2025 | $15,104 | $670,700 | $509,000 | $161,700 |
| 2024 | $14,796 | $670,700 | $509,000 | $161,700 |
| 2023 | $14,796 | $670,700 | $509,000 | $161,700 |
| 2022 | $14,487 | $670,700 | $509,000 | $161,700 |
| 2021 | $14,507 | $670,700 | $509,000 | $161,700 |
| 2020 | $14,474 | $670,700 | $509,000 | $161,700 |
| 2019 | $14,420 | $670,700 | $509,000 | $161,700 |
| 2018 | $12,430 | $133,700 | $86,500 | $47,200 |
| 2017 | $12,362 | $133,700 | $86,500 | $47,200 |
| 2016 | $12,072 | $133,700 | $86,500 | $47,200 |
| 2015 | $11,831 | $133,700 | $86,500 | $47,200 |
| 2014 | $11,441 | $133,700 | $86,500 | $47,200 |
Source: Public Records
Map
Nearby Homes
- 529 Benson Place
- 806 Saint Marks Ave
- 7 Folkstone Dr
- 764 Fairacres Ave
- 131 Wells St
- 519 3rd Ave
- 629 Tremont Ave
- 105 Chestnut Ct Unit 3
- 500 Maple Ct Unit 500
- 820 E Broad St
- 401 Brookside Place
- 4 Cedar St
- 339 2nd Ave
- 305 Cedar St
- 534 E Broad St
- 128 Woodland Ave
- 684 Gallows Hill Rd
- 565 Willow Ave
- 223 5th Ave
- 243 2nd Ave