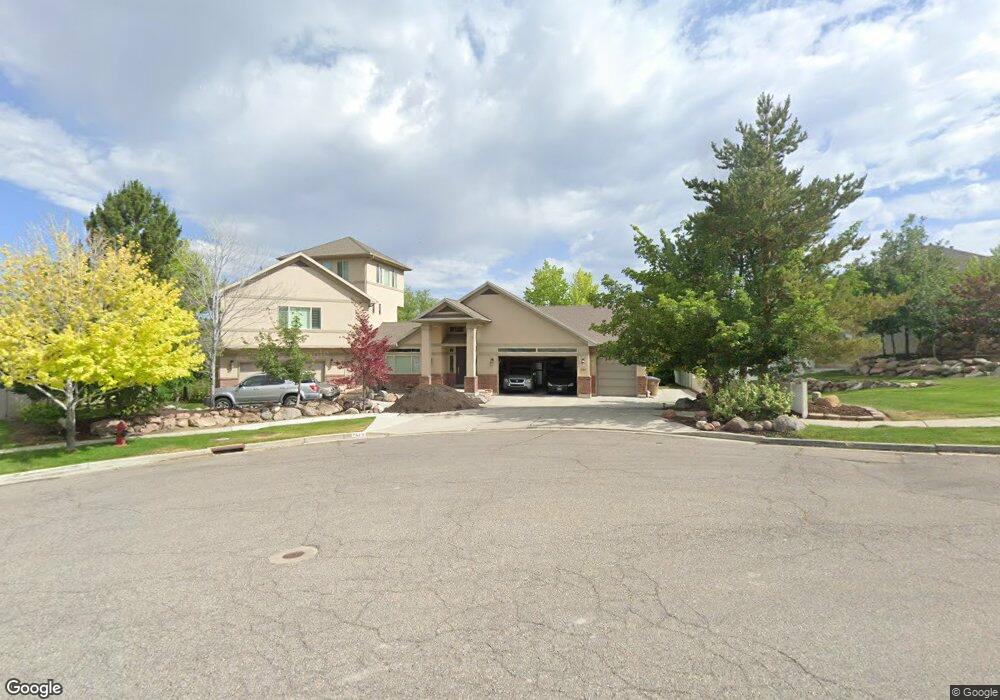
744 Marsh Cove Draper, UT 84020
Estimated Value: $1,007,476 - $1,336,000
3
Beds
2
Baths
3,713
Sq Ft
$310/Sq Ft
Est. Value
About This Home
This home is located at 744 Marsh Cove, Draper, UT 84020 and is currently estimated at $1,151,869, approximately $310 per square foot. 744 Marsh Cove is a home located in Salt Lake County with nearby schools including Crescent School, Mount Jordan Middle School, and American Preparatory Academy - Draper 2 Campus.
Ownership History
Date
Name
Owned For
Owner Type
Purchase Details
Closed on
Aug 5, 2014
Sold by
Jewkes Joseph B
Bought by
Jewkes Joseph B
Current Estimated Value
Home Financials for this Owner
Home Financials are based on the most recent Mortgage that was taken out on this home.
Original Mortgage
$380,800
Outstanding Balance
$290,359
Interest Rate
4.11%
Mortgage Type
New Conventional
Estimated Equity
$861,510
Purchase Details
Closed on
Aug 7, 2013
Sold by
Jewkes Joseph Bryan
Bought by
Jewkes Joseph B
Home Financials for this Owner
Home Financials are based on the most recent Mortgage that was taken out on this home.
Original Mortgage
$398,000
Interest Rate
4.28%
Mortgage Type
New Conventional
Purchase Details
Closed on
Aug 12, 2002
Sold by
Warr Marsha T
Bought by
Jewkes Joseph Bryan and Jewkes Jennifer
Create a Home Valuation Report for This Property
The Home Valuation Report is an in-depth analysis detailing your home's value as well as a comparison with similar homes in the area
Home Values in the Area
Average Home Value in this Area
Purchase History
| Date | Buyer | Sale Price | Title Company |
|---|---|---|---|
| Jewkes Joseph B | -- | Sutherland Title | |
| Jewkes Joseph B | -- | Sutherland Title | |
| Jewkes Joseph Bryan | -- | Metro National Title |
Source: Public Records
Mortgage History
| Date | Status | Borrower | Loan Amount |
|---|---|---|---|
| Open | Jewkes Joseph B | $380,800 | |
| Closed | Jewkes Joseph B | $398,000 |
Source: Public Records
Tax History
| Year | Tax Paid | Tax Assessment Tax Assessment Total Assessment is a certain percentage of the fair market value that is determined by local assessors to be the total taxable value of land and additions on the property. | Land | Improvement |
|---|---|---|---|---|
| 2025 | $5,484 | $1,105,700 | $253,100 | $852,600 |
| 2024 | $5,484 | $1,047,500 | $240,100 | $807,400 |
| 2023 | $5,488 | $1,040,600 | $235,400 | $805,200 |
| 2022 | $5,421 | $992,900 | $230,800 | $762,100 |
| 2021 | $4,665 | $729,800 | $163,900 | $565,900 |
| 2020 | $4,296 | $637,100 | $163,900 | $473,200 |
| 2019 | $4,313 | $625,100 | $151,300 | $473,800 |
| 2016 | $3,528 | $486,500 | $151,300 | $335,200 |
Source: Public Records
Map
Nearby Homes
- 11872 S Ridge Oak Ln
- 552 Sunset Crest Way
- 11979 Draper Ridge Dr
- 802 W Stephens View Way
- 11618 Rolands Dr Unit 316
- 11781 S Halls Creek Rd
- 11749 S Halls Creek Rd
- 11718 S Halls Creek Rd
- 11618 S Douglas Vista Dr
- 11737 S Halls Creek Rd
- 11711 S Halls Creek Rd
- 11617 S Wildrye Field Way
- 11673 S Halls Creek Rd
- 11566 S Junegrass Dr
- 12091 S Lampton View Dr
- 11637 S Sky Atlas Ln
- 504 W Maidengrass Way
- 269 W Beverlee Ann Dr Unit 11720
- 11606 S Halcom Dr
- 12021 Misty Sea Rd
- 734 W Marsh Cove
- 734 Marsh Cove
- 754 Marsh Cove
- 754 W Marsh Cove
- 724 Marsh Cove
- 724 W Marsh Cove
- 737 Marsh Cove
- 737 W Marsh Cove
- 747 W Marsh Cove
- 747 Marsh Cove
- 11974 S 700 W
- 727 Marsh Cove
- 727 W Marsh Cove
- 11982 S 700 W
- 727 Alan Point Dr
- 11964 S 700 W
- 12006 S 700 W
- 717 Alan Point Dr
- 717 W Alan Point Dr
- 11918 S Jenson Farm Cove
Your Personal Tour Guide
Ask me questions while you tour the home.