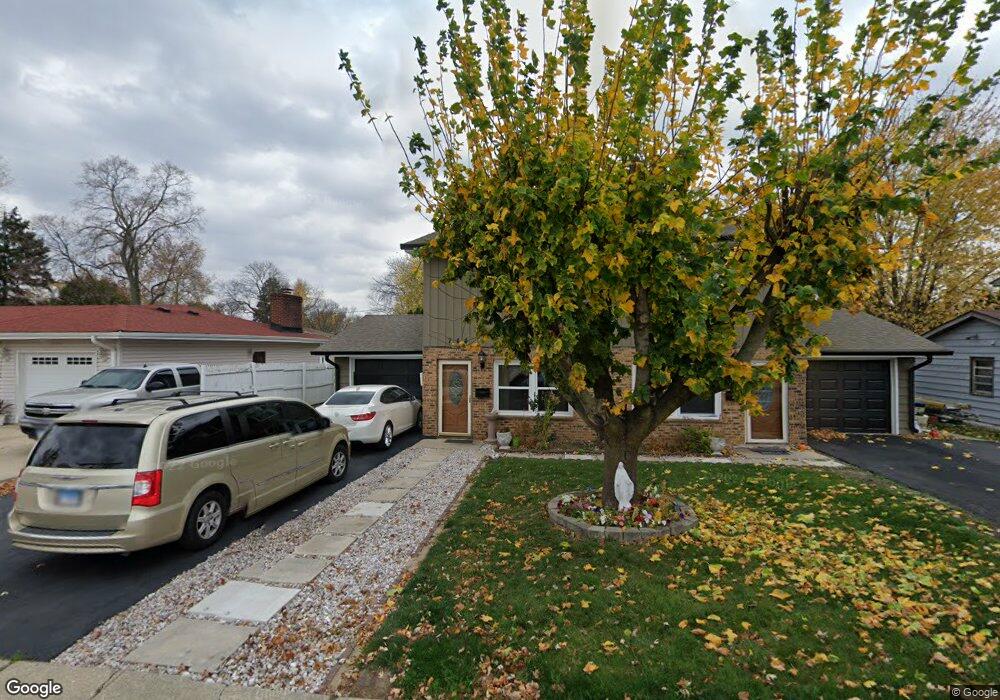
744 N Randall Rd Unit 746 Aurora, IL 60506
Edgelawn Randall NeighborhoodEstimated Value: $328,938 - $349,000
4
Beds
4
Baths
1,792
Sq Ft
$188/Sq Ft
Est. Value
About This Home
This home is located at 744 N Randall Rd Unit 746, Aurora, IL 60506 and is currently estimated at $337,735, approximately $188 per square foot. 744 N Randall Rd Unit 746 is a home located in Kane County with nearby schools including Mccleery Elementary School, Jefferson Middle School, and West Aurora High School.
Ownership History
Date
Name
Owned For
Owner Type
Purchase Details
Closed on
Aug 28, 2004
Sold by
Vasquez Felipe and Vazquez Felipe
Bought by
Vazquez Felipe and Vazquez Anastacio
Current Estimated Value
Home Financials for this Owner
Home Financials are based on the most recent Mortgage that was taken out on this home.
Original Mortgage
$152,250
Interest Rate
5.93%
Mortgage Type
FHA
Purchase Details
Closed on
Oct 10, 2001
Sold by
Serrano Elizabeth
Bought by
Vasquez Felipe and Vasquez Maria
Home Financials for this Owner
Home Financials are based on the most recent Mortgage that was taken out on this home.
Original Mortgage
$147,850
Interest Rate
6.92%
Mortgage Type
FHA
Purchase Details
Closed on
Oct 31, 1994
Sold by
Konrad Irene E and Papas Irene E
Bought by
Serrano Elizabeth
Home Financials for this Owner
Home Financials are based on the most recent Mortgage that was taken out on this home.
Original Mortgage
$87,000
Interest Rate
7.9%
Create a Home Valuation Report for This Property
The Home Valuation Report is an in-depth analysis detailing your home's value as well as a comparison with similar homes in the area
Home Values in the Area
Average Home Value in this Area
Purchase History
| Date | Buyer | Sale Price | Title Company |
|---|---|---|---|
| Vazquez Felipe | -- | Commercial Land Title Ins Co | |
| Vasquez Felipe | $150,000 | -- | |
| Serrano Elizabeth | $100,000 | Chicago Title Insurance Co |
Source: Public Records
Mortgage History
| Date | Status | Borrower | Loan Amount |
|---|---|---|---|
| Closed | Vazquez Felipe | $152,250 | |
| Closed | Vasquez Felipe | $147,850 | |
| Previous Owner | Serrano Elizabeth | $87,000 |
Source: Public Records
Tax History Compared to Growth
Tax History
| Year | Tax Paid | Tax Assessment Tax Assessment Total Assessment is a certain percentage of the fair market value that is determined by local assessors to be the total taxable value of land and additions on the property. | Land | Improvement |
|---|---|---|---|---|
| 2024 | $6,326 | $95,891 | $13,876 | $82,015 |
| 2023 | $5,968 | $85,678 | $12,398 | $73,280 |
| 2022 | $5,946 | $78,173 | $11,312 | $66,861 |
| 2021 | $5,058 | $69,707 | $10,532 | $59,175 |
| 2020 | $5,775 | $72,685 | $9,783 | $62,902 |
| 2019 | $5,510 | $67,344 | $9,064 | $58,280 |
| 2018 | $5,305 | $65,246 | $8,384 | $56,862 |
| 2017 | $5,354 | $63,025 | $7,725 | $55,300 |
| 2016 | $5,152 | $54,494 | $6,622 | $47,872 |
| 2015 | -- | $47,772 | $5,694 | $42,078 |
| 2014 | -- | $44,396 | $5,233 | $39,163 |
| 2013 | -- | $48,119 | $5,158 | $42,961 |
Source: Public Records
Map
Nearby Homes
- 1389 Monomoy St Unit B2
- 833 N Randall Rd Unit C4
- 1351 Monomoy St Unit D
- 1390 N Glen Cir Unit B
- 972 Westgate Dr
- 1104 New Haven Ave
- 1035 Newcastle Ln
- 1296 Yellowpine Dr
- 1149 Newcastle Ln
- 113 Stonewood Place Unit 6D
- 781 N Elmwood Dr
- 795 N Elmwood Dr
- 1735 Greene Ct
- 1751 Greene Ct
- 231 W Downer Place
- 1543 W Downer Place
- 1730 W Galena Blvd Unit 402E
- 943 Charles St
- 616 Morton Ave
- 960 Sapphire Ln
- 750 N Randall Rd Unit 752
- 742 N Randall Rd
- 747 N Glenwood Place
- 743 N Glenwood Place
- 1406 Heather Dr
- 738 N Randall Rd
- 753 N Glenwood Place
- 735 N Glenwood Place
- 1420 Heather Dr
- 755 N Randall Rd Unit D
- 755 N Randall Rd Unit C
- 755 N Randall Rd Unit A
- 755 N Randall Rd Unit B
- 730 N Randall Rd
- 731 N Glenwood Place
- 747 N Randall Rd Unit D
- 747 N Randall Rd Unit C
- 747 N Randall Rd Unit B
- 751 N Randall Rd Unit D
- 751 N Randall Rd Unit B