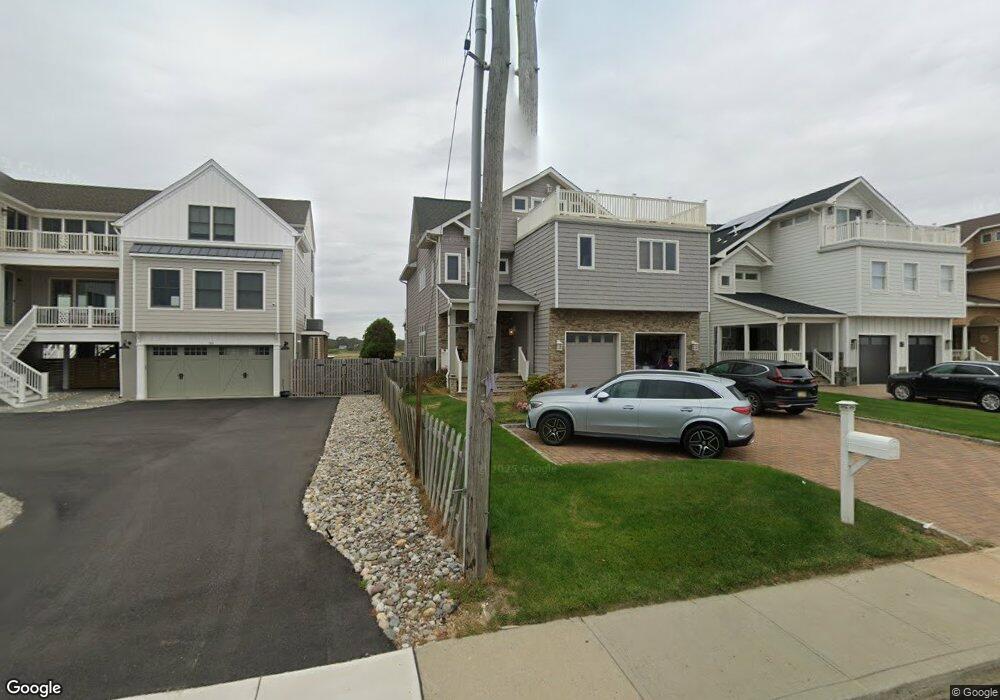
744 Ocean Ave Sea Bright, NJ 07760
Sea Bright NeighborhoodEstimated Value: $2,410,000 - $4,293,000
3
Beds
2
Baths
4,435
Sq Ft
$711/Sq Ft
Est. Value
About This Home
This home is located at 744 Ocean Ave, Sea Bright, NJ 07760 and is currently estimated at $3,155,488, approximately $711 per square foot. 744 Ocean Ave is a home with nearby schools including Wolf Hill Elementary School, Maple Place Elementary and Middle School, and Shore Regional High School.
Ownership History
Date
Name
Owned For
Owner Type
Purchase Details
Closed on
Aug 24, 2017
Sold by
Cerrato Michael J and Fallon Kathleen M
Bought by
Corrado James Joseph and Corrado Mary Rose
Current Estimated Value
Home Financials for this Owner
Home Financials are based on the most recent Mortgage that was taken out on this home.
Original Mortgage
$135,000
Outstanding Balance
$112,255
Interest Rate
3.92%
Mortgage Type
New Conventional
Estimated Equity
$3,043,233
Purchase Details
Closed on
Mar 27, 2017
Sold by
Foss Roger J
Bought by
Cerrato Michael J and Fallon Kathleen M
Purchase Details
Closed on
Oct 7, 2003
Sold by
Nutmeg Dev Corp
Bought by
Cerrato Michael and Fallon Kathleen
Home Financials for this Owner
Home Financials are based on the most recent Mortgage that was taken out on this home.
Original Mortgage
$322,000
Interest Rate
5.9%
Purchase Details
Closed on
Apr 2, 2001
Sold by
D & P Realty
Bought by
Echo Sierra Inc
Create a Home Valuation Report for This Property
The Home Valuation Report is an in-depth analysis detailing your home's value as well as a comparison with similar homes in the area
Home Values in the Area
Average Home Value in this Area
Purchase History
| Date | Buyer | Sale Price | Title Company |
|---|---|---|---|
| Corrado James Joseph | $1,850,000 | Two Rivers Title | |
| Cerrato Michael J | -- | None Available | |
| Cerrato Michael | $1,309,500 | -- | |
| Echo Sierra Inc | $300,000 | -- |
Source: Public Records
Mortgage History
| Date | Status | Borrower | Loan Amount |
|---|---|---|---|
| Open | Corrado James Joseph | $135,000 | |
| Previous Owner | Cerrato Michael | $322,000 |
Source: Public Records
Tax History Compared to Growth
Tax History
| Year | Tax Paid | Tax Assessment Tax Assessment Total Assessment is a certain percentage of the fair market value that is determined by local assessors to be the total taxable value of land and additions on the property. | Land | Improvement |
|---|---|---|---|---|
| 2025 | $26,783 | $2,983,700 | $2,019,900 | $963,800 |
| 2024 | $24,621 | $2,801,600 | $1,900,900 | $900,700 |
| 2023 | $24,621 | $2,404,400 | $1,621,500 | $782,900 |
| 2022 | $16,679 | $2,067,600 | $1,306,300 | $761,300 |
| 2021 | $16,679 | $1,782,600 | $1,046,300 | $736,300 |
| 2020 | $22,059 | $1,718,000 | $996,300 | $721,700 |
| 2019 | $23,026 | $1,696,800 | $976,300 | $720,500 |
| 2018 | $22,725 | $1,582,500 | $914,500 | $668,000 |
| 2017 | $18,461 | $1,265,300 | $774,500 | $490,800 |
| 2016 | $17,491 | $1,340,300 | $794,500 | $545,800 |
| 2015 | $21,173 | $1,055,500 | $347,500 | $708,000 |
| 2014 | $22,201 | $1,111,700 | $367,500 | $744,200 |
Source: Public Records
Map
Nearby Homes
- 8 Black Point Horseshoe
- 3 Black Point Horseshoe
- 7 South St
- 9 South St
- 24 Grant Ave
- 11 South St
- 10 South St
- 24 Surf St
- 129 Avenue of Two Rivers
- 1184 Ocean Ave Unit A3
- 22 Rosalie Ave
- 2 Tradewinds Ln
- 162 E River Rd
- 41 Waterview Way
- 11 Maplewood Ave
- 1332 Ocean Ave Unit 5
- 1340 Ocean Ave Unit 27
- 75 Portland Rd
- 24 Bingham Ct
- 11 Bingham Ct
- 742 Ocean Ave
- 748 Ocean Ave
- 740 Ocean Ave
- 754 Ocean Ave
- 754 Ocean Ave Unit 1 - South
- 754 Ocean Ave Unit 2 - North
- 730 Ocean Ave
- 1258 Ocean Ave
- 760 Ocean Ave
- 760 Ocean Ave Unit 3
- 714 Ocean Ave
- 710 Ocean Ave
- 766 Ocean Ave Unit 9
- 766 Ocean Ave Unit 7
- 766 Ocean Ave Unit 1
- 766 Ocean Ave Unit 8
- 766 Ocean Ave Unit 3
- 766 Ocean Ave Unit 2
- 766 Ocean Ave Unit 5
- 766 Ocean Ave Unit 6