Estimated Value: $323,000 - $344,000
4
Beds
2
Baths
1,574
Sq Ft
$214/Sq Ft
Est. Value
About This Home
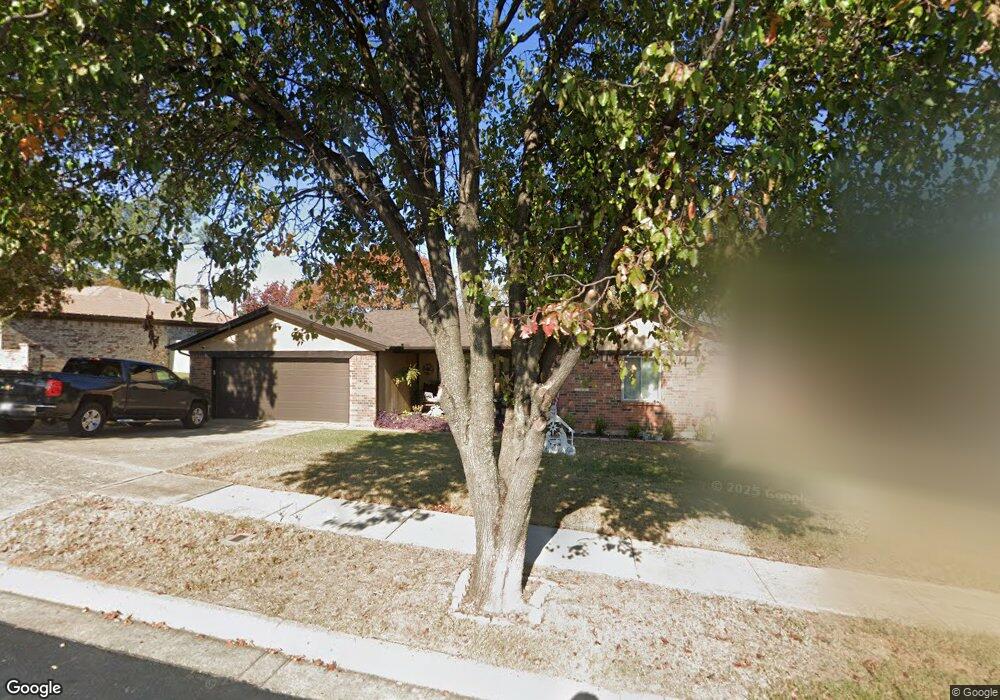
This home is located at 744 Regency Dr, Hurst, TX 76054 and is currently estimated at $336,904, approximately $214 per square foot. 744 Regency Dr is a home located in Tarrant County with nearby schools including W.A. Porter Elementary School, Smithfield Middle School, and Birdville High School.
Ownership History
Date
Name
Owned For
Owner Type
Purchase Details
Closed on
Jun 14, 2016
Sold by
Mcgrew Charlotte Ann
Bought by
Mcgrew Rodney Earl and Mcgrew Charlotte Ann
Current Estimated Value
Purchase Details
Closed on
May 20, 2016
Sold by
Mcgrew Charlotte Ann
Bought by
Mcgrew Rodney E and Mcgrew Charlotte Ann
Purchase Details
Closed on
Jul 14, 1997
Sold by
Ocwen Federal Bank Fsb
Bought by
Prouty Bradford R
Home Financials for this Owner
Home Financials are based on the most recent Mortgage that was taken out on this home.
Original Mortgage
$75,920
Outstanding Balance
$10,621
Interest Rate
7.72%
Estimated Equity
$326,283
Purchase Details
Closed on
Jun 3, 1997
Sold by
Molina Arlette and Rangel Yvonne
Bought by
Ocwen Federal Bank Fsb and Berkeley Federal Bank & Trust Fsb
Home Financials for this Owner
Home Financials are based on the most recent Mortgage that was taken out on this home.
Original Mortgage
$75,920
Outstanding Balance
$10,621
Interest Rate
7.72%
Estimated Equity
$326,283
Create a Home Valuation Report for This Property
The Home Valuation Report is an in-depth analysis detailing your home's value as well as a comparison with similar homes in the area
Home Values in the Area
Average Home Value in this Area
Purchase History
We collect this data history from publicly available records. To have your information removed, we recommend requesting removal directly through your county’s website.
| Date | Buyer | Sale Price | Title Company |
|---|---|---|---|
| Mcgrew Rodney Earl | -- | None Available | |
| Mcgrew Rodney E | -- | None Available | |
| Prouty Bradford R | -- | First American Title Co | |
| Ocwen Federal Bank Fsb | $63,423 | -- |
Source: Public Records
Mortgage History
We collect this data history from publicly available records. To have your information removed, we recommend requesting removal directly through your county’s website.
| Date | Status | Borrower | Loan Amount |
|---|---|---|---|
| Open | Prouty Bradford R | $75,920 |
Source: Public Records
Tax History
| Year | Tax Paid | Tax Assessment Tax Assessment Total Assessment is a certain percentage of the fair market value that is determined by local assessors to be the total taxable value of land and additions on the property. | Land | Improvement |
|---|---|---|---|---|
| 2025 | $3,982 | $273,000 | $60,000 | $213,000 |
| 2024 | $4,821 | $289,690 | $60,000 | $229,690 |
| 2023 | $6,422 | $319,307 | $60,000 | $259,307 |
| 2022 | $6,316 | $268,035 | $40,000 | $228,035 |
| 2021 | $6,024 | $244,122 | $40,000 | $204,122 |
| 2020 | $5,425 | $211,120 | $40,000 | $171,120 |
| 2019 | $5,314 | $213,773 | $40,000 | $173,773 |
| 2018 | $4,255 | $183,811 | $40,000 | $143,811 |
| 2017 | $4,459 | $186,953 | $40,000 | $146,953 |
| 2016 | $4,054 | $163,472 | $35,000 | $128,472 |
| 2015 | $3,322 | $138,100 | $20,000 | $118,100 |
| 2014 | $3,322 | $138,100 | $20,000 | $118,100 |
Source: Public Records
Map
Nearby Homes
- 748 Regency Dr
- 2805 Autumn Dr
- 9208 Winslow Ct
- 2904 Steve Dr
- 2708 Steeplechase Ct
- 2676 Bent Tree Dr
- 729 Bent Tree Ct
- 2605 Briargrove Dr
- 6350 Rogers Dr
- 6400 Rogers Dr
- 6800 Woodland Hills Dr
- 9104 Nob Hill Dr
- 2613 Bent Tree Dr
- 6625 Crane Rd
- 505 Springhill Dr
- 6432 Brynwyck Ln
- 425 Marseille Dr
- 613 Evergreen Dr
- 437 Heneretta Dr
- 2221 Farrington Ln
- 740 Regency Dr
- 745 Spring Valley Dr
- 741 Spring Valley Dr
- 749 Spring Valley Dr
- 736 Regency Dr
- 752 Regency Dr
- 753 Spring Valley Dr
- 737 Spring Valley Dr
- 6516 Precinct Line Rd
- 732 Regency Dr
- 2717 Springbrooke Dr
- 733 Spring Valley Dr
- 744 Spring Valley Dr
- 740 Spring Valley Dr
- 748 Spring Valley Dr
- 2713 Springbrooke Dr
- 736 Spring Valley Dr
- 6500 Precinct Line Rd
- 728 Regency Dr
- 752 Spring Valley Dr
Your Personal Tour Guide
Ask me questions while you tour the home.