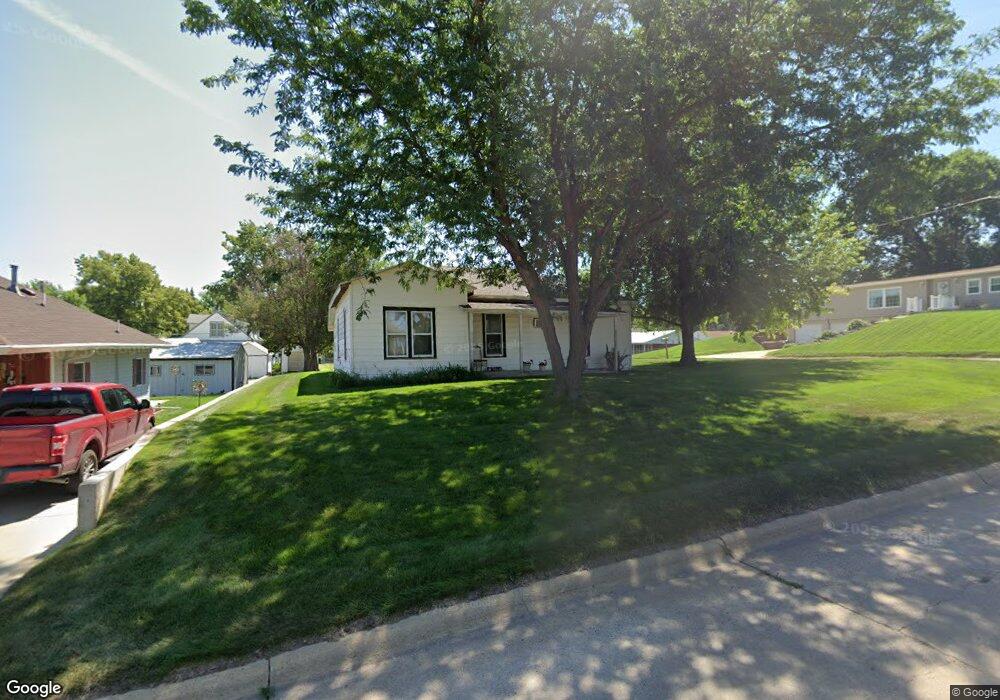
744 S 13th Ave Broken Bow, NE 68822
Estimated Value: $81,000 - $140,000
--
Bed
1
Bath
1,044
Sq Ft
$101/Sq Ft
Est. Value
About This Home
This home is located at 744 S 13th Ave, Broken Bow, NE 68822 and is currently estimated at $105,376, approximately $100 per square foot. 744 S 13th Ave is a home located in Custer County with nearby schools including North Park Elementary School, Broken Bow Junior High School, and Broken Bow High School.
Ownership History
Date
Name
Owned For
Owner Type
Purchase Details
Closed on
Feb 2, 2010
Sold by
Myers Christopher A and Myers Jami
Bought by
Mccandless Eldon and Mccandless Connie
Current Estimated Value
Purchase Details
Closed on
Jul 27, 2009
Sold by
Federal National Mortgage Assn
Bought by
Myers Christopher A and Myers Jami
Purchase Details
Closed on
Apr 9, 2009
Sold by
Spanel Richard B
Bought by
Federal National Mortgage Assn
Purchase Details
Closed on
May 4, 2006
Sold by
Barker James R & Lucille I Tr
Bought by
Spanel Richard B
Create a Home Valuation Report for This Property
The Home Valuation Report is an in-depth analysis detailing your home's value as well as a comparison with similar homes in the area
Home Values in the Area
Average Home Value in this Area
Purchase History
| Date | Buyer | Sale Price | Title Company |
|---|---|---|---|
| Mccandless Eldon | $25,000 | -- | |
| Myers Christopher A | $19,500 | -- | |
| Federal National Mortgage Assn | -- | -- | |
| Spanel Richard B | $43,000 | -- |
Source: Public Records
Tax History Compared to Growth
Tax History
| Year | Tax Paid | Tax Assessment Tax Assessment Total Assessment is a certain percentage of the fair market value that is determined by local assessors to be the total taxable value of land and additions on the property. | Land | Improvement |
|---|---|---|---|---|
| 2025 | $745 | $62,524 | $10,195 | $52,329 |
| 2024 | $745 | $55,167 | $10,195 | $44,972 |
| 2023 | $858 | $54,765 | $10,195 | $44,570 |
| 2022 | $837 | $45,602 | $10,195 | $35,407 |
| 2021 | $807 | $44,965 | $9,558 | $35,407 |
| 2020 | $800 | $44,965 | $9,558 | $35,407 |
| 2019 | $751 | $42,326 | $4,779 | $37,547 |
| 2017 | $612 | $33,494 | $4,779 | $28,715 |
| 2016 | $636 | $31,837 | $3,122 | $28,715 |
| 2015 | $627 | $31,130 | $3,086 | $28,044 |
| 2014 | $627 | $28,300 | $2,805 | $25,495 |
Source: Public Records
Map
Nearby Homes