744 Sandwich Rd Buzzards Bay, MA 02532
Estimated Value: $395,652 - $472,000
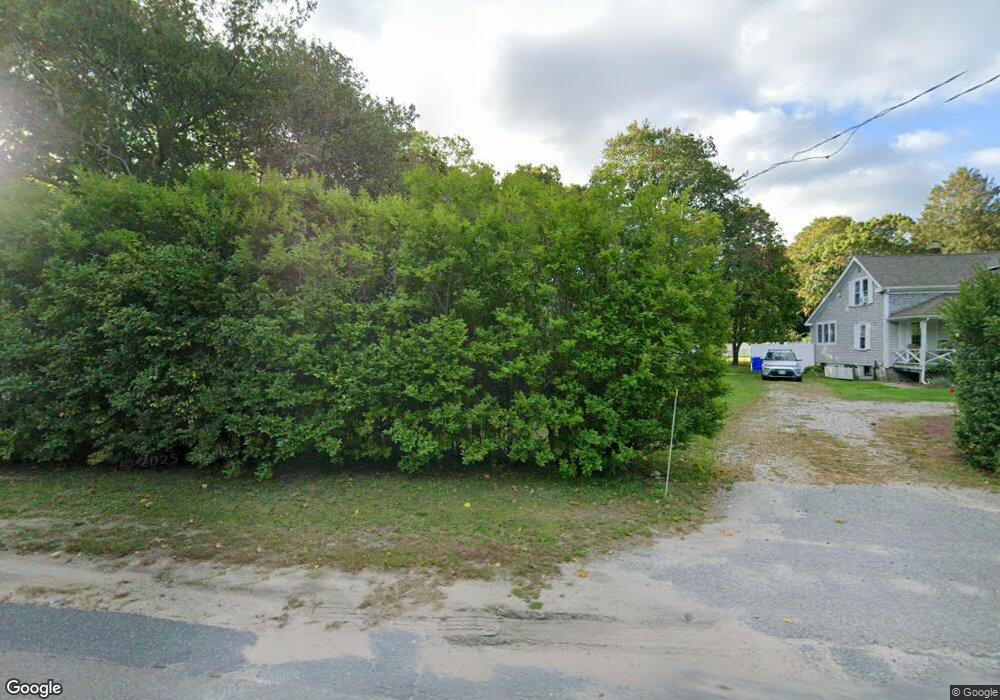
About This Home
This home is located at 744 Sandwich Rd, Buzzards Bay, MA 02532 and is currently estimated at $424,663, approximately $511 per square foot. 744 Sandwich Rd is a home located in Barnstable County with nearby schools including Bourne High School, Bridgeview Montessori School, and Waldorf School of Cape Cod.
Ownership History
We collect this data history from publicly available records. To have your information removed, we recommend requesting removal directly through your county’s website.
Purchase Details
Home Financials for this Owner
Home Financials are based on the most recent Mortgage that was taken out on this home.Purchase History
We collect this data history from publicly available records. To have your information removed, we recommend requesting removal directly through your county’s website.
| Date | Buyer | Sale Price | Title Company |
|---|---|---|---|
| $180,000 | -- | ||
| $180,000 | -- |
Mortgage History
We collect this data history from publicly available records. To have your information removed, we recommend requesting removal directly through your county’s website.
| Date | Status | Borrower | Loan Amount |
|---|---|---|---|
| Open | $176,739 | ||
| Closed | $176,739 |
Tax History
We collect this data history from publicly available records. To have your information removed, we recommend requesting removal directly through your county’s website.
| Year | Tax Paid | Tax Assessment Tax Assessment Total Assessment is a certain percentage of the fair market value that is determined by local assessors to be the total taxable value of land and additions on the property. | Land | Improvement |
|---|---|---|---|---|
| 2025 | $2,420 | $309,800 | $148,000 | $161,800 |
| 2024 | $2,507 | $312,600 | $158,500 | $154,100 |
| 2023 | $2,438 | $276,700 | $140,300 | $136,400 |
| 2022 | $2,345 | $232,400 | $124,200 | $108,200 |
| 2021 | $2,278 | $211,500 | $113,000 | $98,500 |
| 2020 | $2,204 | $205,200 | $111,900 | $93,300 |
| 2019 | $2,102 | $200,000 | $111,900 | $88,100 |
| 2018 | $1,964 | $186,300 | $106,600 | $79,700 |
| 2017 | $2,142 | $208,000 | $129,100 | $78,900 |
| 2016 | $1,965 | $193,400 | $129,100 | $64,300 |
| 2015 | $1,593 | $158,200 | $93,900 | $64,300 |
Map
- E 2 Beach Plum Ln Unit E
- 8 Herring Pond Rd
- 2 Beach Plum Lane U: E Ln Unit E
- 896 Sandwich Rd
- 6 Aspen Rd Unit 6
- 6 Aspen Rd
- 51 Commonwealth Ave
- 17 Hilltop Dr
- 18 Gibbs Rd
- 1 Homestead Rd
- 4 Andrew Rd
- 14 Sir Lancelot Dr
- 7 Great Pine Dr
- 6 Luigi Ave
- 16 Ocean Pines Dr Unit A
- 1067 Sandwich Rd
- 209 Herring Pond Rd
- 0 State Rd
- 15 Clark Rd
- 133 Phillips Rd
- 754 Sandwich Rd
- 754 Sandwich Rd
- 770 Sandwich
- 1 Jillian Dr
- 1 Jillian Dr
- 2 Jillian Dr
- 4 Jillian Dr
- 740 Sandwich Rd
- 740 Sandwich Rd
- 3 Jillian Dr
- 4 Jillian Ln
- 3 Jillian Dr
- 3 Jillian Ln
- 738 Sandwich Rd
- 738 Sandwich Rd
- 5 Jillian Dr
- 5 Jillian Dr
- 783 Sandwich Rd
- 783 Sandwich Rd Unit G
- 783 Sandwich Rd Unit 1
Ask me questions while you tour the home.