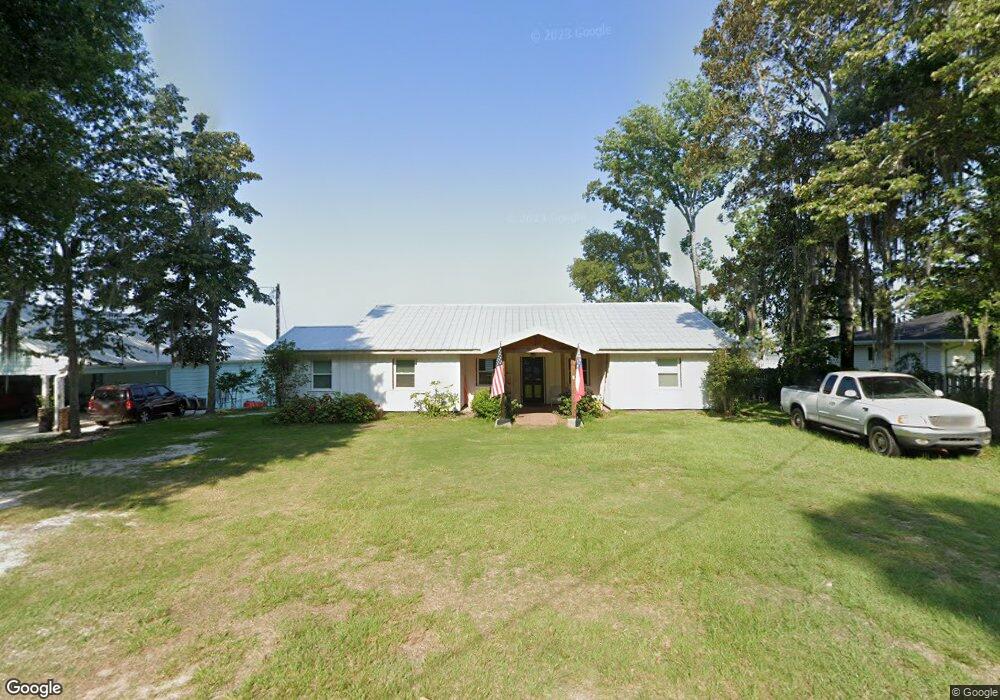
744 Scenic Route Cordele, GA 31015
Estimated Value: $450,000 - $517,000
3
Beds
2
Baths
1,513
Sq Ft
$309/Sq Ft
Est. Value
About This Home
This home is located at 744 Scenic Route, Cordele, GA 31015 and is currently estimated at $468,244, approximately $309 per square foot. 744 Scenic Route is a home located in Crisp County with nearby schools including Crisp County Elementary School, Crisp County Primary School, and Crisp County Middle School.
Ownership History
Date
Name
Owned For
Owner Type
Purchase Details
Closed on
Apr 15, 2016
Sold by
Jones Edd C
Bought by
Buckley Grant Cox
Current Estimated Value
Home Financials for this Owner
Home Financials are based on the most recent Mortgage that was taken out on this home.
Original Mortgage
$251,750
Outstanding Balance
$200,328
Interest Rate
3.73%
Mortgage Type
New Conventional
Estimated Equity
$267,916
Purchase Details
Closed on
Jan 1, 2015
Sold by
Jones Edd C
Bought by
Jones Edd C
Purchase Details
Closed on
Oct 17, 2002
Sold by
Jones Edd Ciii and Jones Robin M
Bought by
Jones Edd C
Purchase Details
Closed on
Jun 26, 1996
Sold by
Edenfield Lonnie M
Bought by
Jones Edd Ciii and Jones Robi
Purchase Details
Closed on
Sep 30, 1994
Sold by
Edenfield Lonnie +
Bought by
Edenfield Lonnie M
Purchase Details
Closed on
Nov 9, 1990
Sold by
Wms Donald and Wms Sandra
Bought by
Edenfield Lonnie +
Purchase Details
Closed on
Sep 24, 1990
Bought by
Wms Donald and Wms Sandra
Create a Home Valuation Report for This Property
The Home Valuation Report is an in-depth analysis detailing your home's value as well as a comparison with similar homes in the area
Home Values in the Area
Average Home Value in this Area
Purchase History
| Date | Buyer | Sale Price | Title Company |
|---|---|---|---|
| Buckley Grant Cox | $265,000 | -- | |
| Jones Edd C | $335,000 | -- | |
| Jones Edd C | -- | -- | |
| Jones Edd Ciii | $122,000 | -- | |
| Edenfield Lonnie M | -- | -- | |
| Edenfield Lonnie + | $82,500 | -- | |
| Wms Donald | -- | -- |
Source: Public Records
Mortgage History
| Date | Status | Borrower | Loan Amount |
|---|---|---|---|
| Open | Buckley Grant Cox | $251,750 |
Source: Public Records
Tax History Compared to Growth
Tax History
| Year | Tax Paid | Tax Assessment Tax Assessment Total Assessment is a certain percentage of the fair market value that is determined by local assessors to be the total taxable value of land and additions on the property. | Land | Improvement |
|---|---|---|---|---|
| 2024 | $4,017 | $150,363 | $90,380 | $59,983 |
| 2023 | $3,626 | $131,132 | $90,380 | $40,752 |
| 2022 | $3,058 | $110,908 | $72,304 | $38,604 |
| 2021 | $3,101 | $104,570 | $72,304 | $32,266 |
| 2020 | $3,082 | $103,790 | $72,304 | $31,486 |
| 2019 | $3,063 | $103,790 | $72,304 | $31,486 |
| 2018 | $2,463 | $80,435 | $49,327 | $31,108 |
| 2017 | $2,474 | $80,435 | $49,327 | $31,108 |
| 2016 | $2,470 | $80,435 | $49,327 | $31,108 |
| 2015 | -- | $80,435 | $49,327 | $31,108 |
| 2014 | -- | $80,435 | $49,327 | $31,108 |
| 2013 | -- | $80,434 | $49,326 | $31,108 |
Source: Public Records
Map
Nearby Homes
- Lot 1, 2 Scenic Route
- 580 Scenic Route
- Lot 3,4 Scenic Route
- 850 Scenic Route
- 115 Ellis Ct
- 515 Scenic Route
- 600 Scenic Route
- 466 Scenic Route
- 153 Landing Rd
- 984 Scenic Route
- 141 Landing Rd
- 631 Flintside Dr
- 687 Flintside Dr
- 475 N Cedar Creek Rd
- 418 Flintside Dr
- 103 Cedar Slough Ct
- 251 N Cedar Creek Rd
- 0 Lot #3 & Part Lot#4 Unit 59461
- 228 Cedar Point Cir
- 111 Cedar Creek Rd S
- 748 Scenic Route
- 740 Scenic Route
- 752 Scenic Route
- 728 Scenic Route
- 722 Scenic Route
- 772 Scenic Route
- 718 Scenic Route
- 826 Scenic Route
- 710 Scenic Route
- 808 Scenic Route
- 824 Scenic Route
- 830 Scenic Route
- 820 Scenic Route
- 706 Scenic Route
- 805 Scenic Route
- 842 Scenic Route
- 702 Scenic Route
- LOT17,18 Lincoln Pinch Cir
- 146 Lincoln Pinch Cir
- 846 Scenic Route