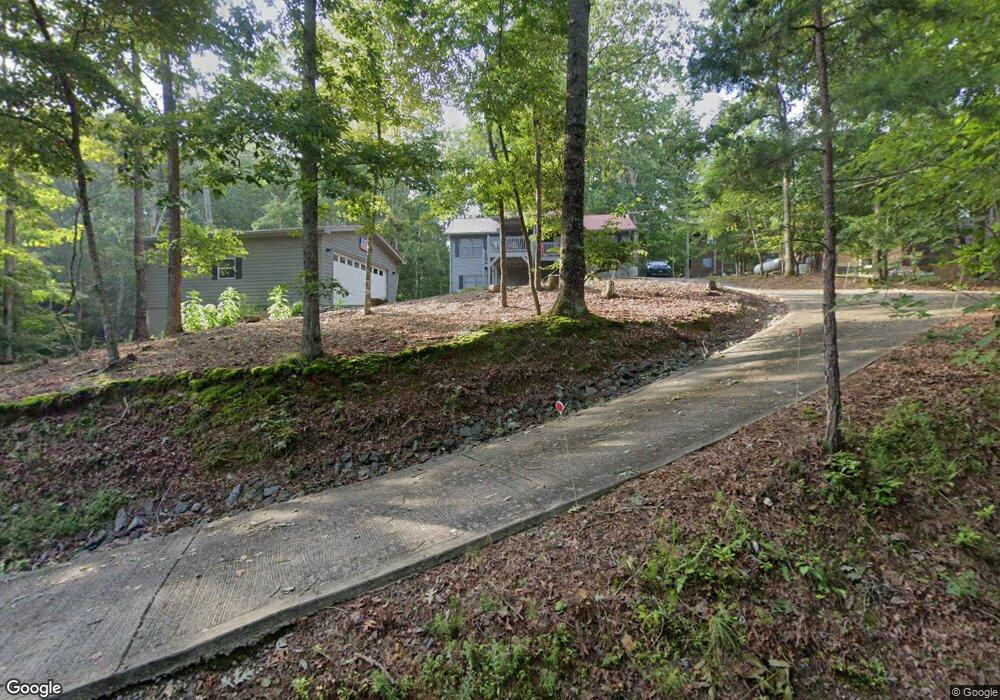
744 Spalding Cir Ellijay, GA 30540
Estimated Value: $408,171 - $487,000
3
Beds
3
Baths
2,184
Sq Ft
$204/Sq Ft
Est. Value
About This Home
This home is located at 744 Spalding Cir, Ellijay, GA 30540 and is currently estimated at $446,293, approximately $204 per square foot. 744 Spalding Cir is a home located in Gilmer County with nearby schools including Ellijay Elementary School, Clear Creek Elementary School, and Clear Creek Middle School.
Ownership History
Date
Name
Owned For
Owner Type
Purchase Details
Closed on
Mar 18, 2011
Sold by
Federal National Mortgage Association
Bought by
Quido Frank and Quido Suzanne
Current Estimated Value
Home Financials for this Owner
Home Financials are based on the most recent Mortgage that was taken out on this home.
Original Mortgage
$89,910
Outstanding Balance
$4,191
Interest Rate
4.95%
Mortgage Type
New Conventional
Estimated Equity
$442,102
Purchase Details
Closed on
Sep 7, 2010
Sold by
Onewest Bank Fsb
Bought by
Federal National Mortgage Association
Purchase Details
Closed on
Dec 31, 2002
Sold by
Craftsmen Quality Homes Llc
Bought by
Clair St and Clair Jennifer
Purchase Details
Closed on
Feb 26, 2002
Sold by
Moore Billy L
Bought by
Craftsmen Quality Homes Llc
Purchase Details
Closed on
Aug 1, 1985
Bought by
Moore Billy L
Purchase Details
Closed on
Jul 1, 1984
Bought by
Moore Billy L
Purchase Details
Closed on
May 1, 1983
Bought by
Moore Billy L
Create a Home Valuation Report for This Property
The Home Valuation Report is an in-depth analysis detailing your home's value as well as a comparison with similar homes in the area
Home Values in the Area
Average Home Value in this Area
Purchase History
| Date | Buyer | Sale Price | Title Company |
|---|---|---|---|
| Quido Frank | $99,900 | -- | |
| Federal National Mortgage Association | $131,193 | -- | |
| Onewest Bank Fsb | $131,193 | -- | |
| Clair St | $89,300 | -- | |
| Craftsmen Quality Homes Llc | $6,000 | -- | |
| Moore Billy L | -- | -- | |
| Moore Billy L | -- | -- | |
| Moore Billy L | -- | -- |
Source: Public Records
Mortgage History
| Date | Status | Borrower | Loan Amount |
|---|---|---|---|
| Open | Quido Frank | $89,910 |
Source: Public Records
Tax History Compared to Growth
Tax History
| Year | Tax Paid | Tax Assessment Tax Assessment Total Assessment is a certain percentage of the fair market value that is determined by local assessors to be the total taxable value of land and additions on the property. | Land | Improvement |
|---|---|---|---|---|
| 2024 | $427 | $156,600 | $9,480 | $147,120 |
| 2023 | $439 | $143,280 | $7,600 | $135,680 |
| 2022 | $441 | $124,040 | $4,480 | $119,560 |
| 2021 | $488 | $103,960 | $4,000 | $99,960 |
| 2020 | $548 | $86,000 | $3,840 | $82,160 |
| 2019 | $573 | $86,160 | $4,000 | $82,160 |
| 2018 | $562 | $81,640 | $4,000 | $77,640 |
| 2017 | $498 | $60,320 | $4,800 | $55,520 |
| 2016 | $1,526 | $60,800 | $4,000 | $56,800 |
| 2015 | $1,144 | $46,400 | $2,680 | $43,720 |
| 2014 | $1,061 | $41,400 | $1,800 | $39,600 |
| 2013 | -- | $41,440 | $1,800 | $39,640 |
Source: Public Records
Map
Nearby Homes
- 1162 Spalding Cir
- 480 Alcan Way
- 173 Birchwood Dr
- 193 Alm Ln
- 193 Alm Ln Unit 1203 1204
- Lot 25 Birchwood Dr
- 84 Pin Oak Ln
- 0 Alcan Way Unit 7652137
- LOT 145 Alcan Way
- 0 Alcan Way Unit 10525822
- 381 Gateway Dr Unit 1015
- 122 Acadia Dr
- 122 Acadia Dr Unit 110
- Lot 99 Acella Ct
- 6 Spalding Cir
- 383 Acadia Dr
- 956 Lemmon Ln
- 115 Adina Dr
- 241 Lemmon Ln
- 744 Spaulding Cir
- 716 Spalding Cir
- 716 Spaulding Cir
- 1176 Spalding Cir
- 1190 Spalding Cir
- 540 Spalding Cir
- 520 Spaulding Cir
- 15 Alm Ln Unit 5036
- 11 Key Ct
- 11 Key Ct
- 26 Calm Ct Unit 1172
- 26 Calm Ct
- 0 Calm Ct
- 99 Alm Ln
- 64 Alm Ln
- 64 Alm Ln Unit 1226
- 0 Alm Ln Unit 8694604
- 0 Alm Ln Unit 3185490
- 416 Spalding Cir
- 1211 Spalding Cir