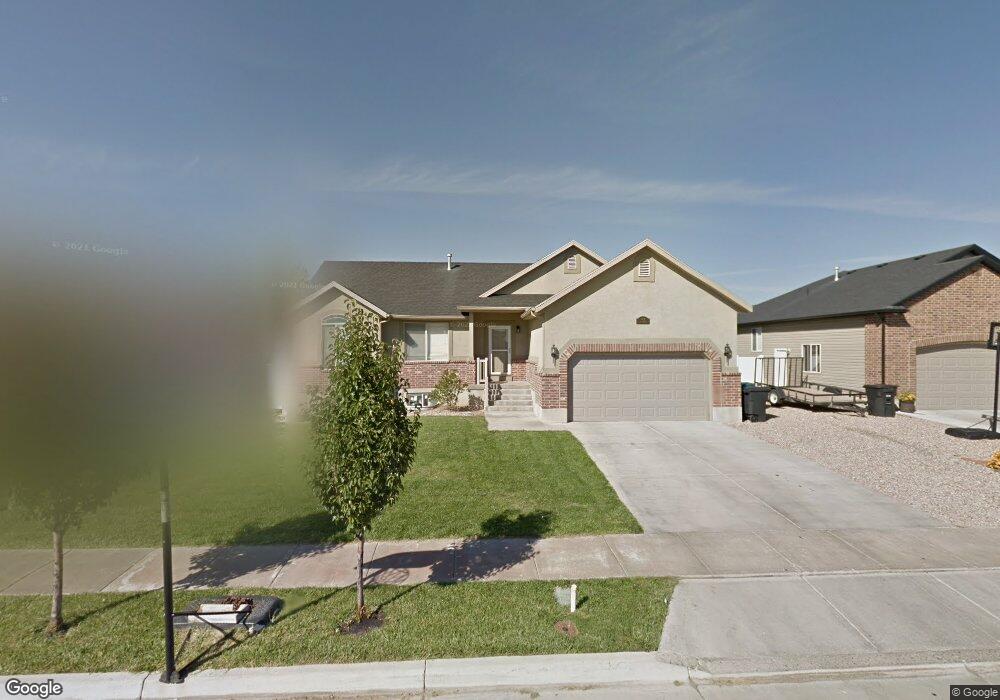
744 W 25 N Clearfield, UT 84015
Estimated Value: $557,000 - $646,000
7
Beds
3
Baths
2,805
Sq Ft
$209/Sq Ft
Est. Value
About This Home
This home is located at 744 W 25 N, Clearfield, UT 84015 and is currently estimated at $585,195, approximately $208 per square foot. 744 W 25 N is a home located in Davis County with nearby schools including Holt Elementary School, North Davis Junior High School, and Syracuse High School.
Ownership History
Date
Name
Owned For
Owner Type
Purchase Details
Closed on
Dec 15, 2022
Sold by
Belford Property & Assets Management Llc
Bought by
Quiles Loida Calderon and Delcalderon Loidali Del
Current Estimated Value
Home Financials for this Owner
Home Financials are based on the most recent Mortgage that was taken out on this home.
Original Mortgage
$19,540
Outstanding Balance
$18,860
Interest Rate
6.31%
Estimated Equity
$566,335
Purchase Details
Closed on
Feb 26, 2021
Sold by
Belford Anthony
Bought by
Belford Property & Assets Management Llc
Home Financials for this Owner
Home Financials are based on the most recent Mortgage that was taken out on this home.
Original Mortgage
$288,250
Interest Rate
2.7%
Mortgage Type
New Conventional
Purchase Details
Closed on
Feb 17, 2018
Sold by
Belford Anthony
Bought by
Belford Anthony
Home Financials for this Owner
Home Financials are based on the most recent Mortgage that was taken out on this home.
Original Mortgage
$215,000
Interest Rate
4.04%
Mortgage Type
New Conventional
Purchase Details
Closed on
Apr 9, 2009
Sold by
Gomelsky Asya
Bought by
Belford Anthony
Home Financials for this Owner
Home Financials are based on the most recent Mortgage that was taken out on this home.
Original Mortgage
$214,051
Interest Rate
5.06%
Mortgage Type
FHA
Purchase Details
Closed on
Jan 17, 2007
Sold by
Mark Higley Construction Llc
Bought by
Gomelsky Asya
Home Financials for this Owner
Home Financials are based on the most recent Mortgage that was taken out on this home.
Original Mortgage
$193,000
Interest Rate
7.3%
Mortgage Type
Purchase Money Mortgage
Purchase Details
Closed on
Dec 15, 2005
Sold by
M & D Developers Llc
Bought by
Mark Higley Construction Llc
Home Financials for this Owner
Home Financials are based on the most recent Mortgage that was taken out on this home.
Original Mortgage
$206,250
Interest Rate
6.36%
Mortgage Type
Purchase Money Mortgage
Create a Home Valuation Report for This Property
The Home Valuation Report is an in-depth analysis detailing your home's value as well as a comparison with similar homes in the area
Home Values in the Area
Average Home Value in this Area
Purchase History
| Date | Buyer | Sale Price | Title Company |
|---|---|---|---|
| Quiles Loida Calderon | -- | -- | |
| Belford Property & Assets Management Llc | -- | Cottonwood Title Ins | |
| Belford Anthony | -- | Old Republic Title | |
| Belford Anthony | -- | Backman Title Services | |
| Gomelsky Asya | -- | Heritage West Title Ins Agen | |
| Mark Higley Construction Llc | -- | Heritage West Title Ins Agen |
Source: Public Records
Mortgage History
| Date | Status | Borrower | Loan Amount |
|---|---|---|---|
| Open | Quiles Loida Calderon | $19,540 | |
| Open | Quiles Loida Calderon | $505,672 | |
| Previous Owner | Belford Property & Assets Management Llc | $288,250 | |
| Previous Owner | Belford Anthony | $215,000 | |
| Previous Owner | Belford Anthony | $214,051 | |
| Previous Owner | Gomelsky Asya | $193,000 | |
| Previous Owner | Mark Higley Construction Llc | $206,250 |
Source: Public Records
Tax History
| Year | Tax Paid | Tax Assessment Tax Assessment Total Assessment is a certain percentage of the fair market value that is determined by local assessors to be the total taxable value of land and additions on the property. | Land | Improvement |
|---|---|---|---|---|
| 2025 | $3,333 | $298,650 | $72,093 | $226,557 |
| 2024 | $3,217 | $290,400 | $68,925 | $221,475 |
| 2023 | $2,939 | $487,000 | $110,323 | $376,677 |
| 2022 | $3,155 | $514,000 | $114,925 | $399,075 |
| 2021 | $2,711 | $367,000 | $67,057 | $299,943 |
| 2020 | $2,365 | $318,000 | $56,367 | $261,633 |
| 2019 | $2,298 | $305,000 | $59,172 | $245,828 |
| 2018 | $2,065 | $267,000 | $52,521 | $214,479 |
| 2016 | $1,748 | $118,195 | $20,970 | $97,225 |
| 2015 | $1,890 | $121,825 | $20,970 | $100,855 |
| 2014 | $1,713 | $111,897 | $20,970 | $90,927 |
| 2013 | -- | $100,100 | $35,640 | $64,460 |
Source: Public Records
Map
Nearby Homes