Estimated Value: $581,000 - $615,000
3
Beds
2
Baths
1,787
Sq Ft
$337/Sq Ft
Est. Value
About This Home
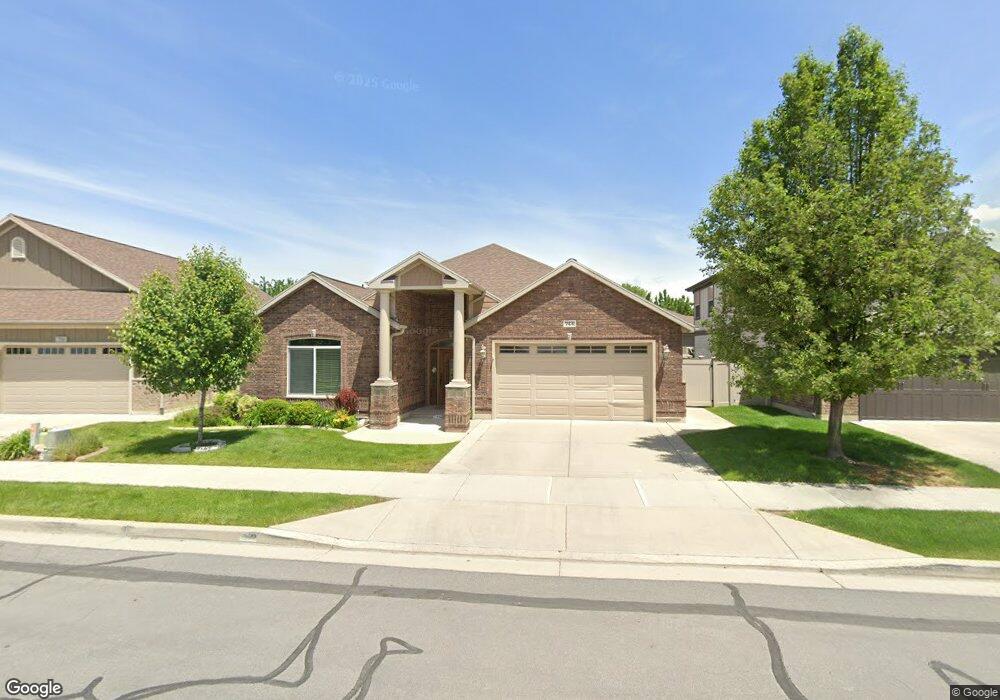
This home is located at 744 W Lazy Oak Way, Sandy, UT 84070 and is currently estimated at $601,416, approximately $336 per square foot. 744 W Lazy Oak Way is a home located in Salt Lake County with nearby schools including Sandy Elementary School, Mount Jordan Middle School, and Jordan High.
Ownership History
Date
Name
Owned For
Owner Type
Purchase Details
Closed on
Oct 11, 2024
Sold by
Parry Beverly
Bought by
Beverly June Parry Trust and Parry
Current Estimated Value
Purchase Details
Closed on
Apr 9, 2020
Sold by
Poppe Bryan Lee and Estate Of Susan O Carlisle
Bought by
Parry Beverty
Purchase Details
Closed on
Jul 9, 2013
Sold by
Jensen Richard G and Jensen Sharon H
Bought by
Carlisle Susan O
Purchase Details
Closed on
Jun 30, 2006
Sold by
Priority Builders Llc
Bought by
Jensen Richard G and Jensen Sharon H
Home Financials for this Owner
Home Financials are based on the most recent Mortgage that was taken out on this home.
Original Mortgage
$180,000
Interest Rate
6.57%
Mortgage Type
Purchase Money Mortgage
Create a Home Valuation Report for This Property
The Home Valuation Report is an in-depth analysis detailing your home's value as well as a comparison with similar homes in the area
Home Values in the Area
Average Home Value in this Area
Purchase History
| Date | Buyer | Sale Price | Title Company |
|---|---|---|---|
| Beverly June Parry Trust | -- | None Listed On Document | |
| Parry Beverty | -- | Title One | |
| Carlisle Susan O | -- | Backman Title Services | |
| Jensen Richard G | -- | Title One | |
| Priority Builders Llc | -- | Title One | |
| The Vistas Llc | -- | Title One |
Source: Public Records
Mortgage History
| Date | Status | Borrower | Loan Amount |
|---|---|---|---|
| Previous Owner | Jensen Richard G | $180,000 |
Source: Public Records
Tax History Compared to Growth
Tax History
| Year | Tax Paid | Tax Assessment Tax Assessment Total Assessment is a certain percentage of the fair market value that is determined by local assessors to be the total taxable value of land and additions on the property. | Land | Improvement |
|---|---|---|---|---|
| 2025 | $3,041 | $590,800 | $125,200 | $465,600 |
| 2024 | $3,041 | $562,400 | $119,000 | $443,400 |
| 2023 | $2,876 | $530,300 | $112,200 | $418,100 |
| 2022 | $2,995 | $539,600 | $110,000 | $429,600 |
| 2021 | $2,683 | $411,400 | $89,700 | $321,700 |
| 2020 | $2,484 | $359,200 | $75,800 | $283,400 |
| 2019 | $2,424 | $341,600 | $75,800 | $265,800 |
| 2018 | $2,188 | $321,000 | $72,400 | $248,600 |
| 2017 | $2,137 | $299,500 | $72,400 | $227,100 |
| 2016 | $3,857 | $287,400 | $72,400 | $215,000 |
| 2015 | -- | $262,200 | $73,800 | $188,400 |
| 2014 | $3,472 | $234,700 | $66,900 | $167,800 |
Source: Public Records
Map
Nearby Homes
- 662 W Jefferson Cove
- 9144 S Jefferson Place
- 9332 S Chartres Ave
- 885 W Chartres Ave
- 9121 S Hidden Peak Dr
- 8976 S 1050 W
- 9297 S Avignon Place
- 9095 S 1150 W
- 1116 W 9440 S
- 1184 W Michaelsen Way
- 9532 S Willow Trail Way
- 8843 Capernaum Rd
- 8772 S Midvalley Dr
- 8713 Mountain Meadow Dr
- 8686 Covewood Place
- 9837 Jordan Ridge Rd
- 9141 S Little Creek Dr
- 9847 S 1000 W
- 8686 S Temple Dr
- 1254 W 8680 S
- 744 Lazy Oak Way
- 750 Lazy Oak Way
- 736 Lazy Oak Way
- 756 Lazy Oak Way
- 9156 Club Oaks Dr
- 743 W Oak Green Dr
- 749 W Oak Green Dr
- 757 W Lazy Oak Way
- 757 W Lazy Oak Way Unit 103
- 762 Lazy Oak Way
- 762 W Lazy Oak Way
- 9146 S Club Oaks Dr
- 9146 Club Oaks Dr
- 743 Oak Green Dr
- 9179 S Club Oaks Dr
- 9179 Club Oaks Dr
- 9185 Club Oaks Dr
- 9185 S Club Oaks Dr
- 9171 S Club Oaks Dr
- 9171 Club Oaks Dr