Estimated Value: $309,000 - $328,000
2
Beds
3
Baths
1,386
Sq Ft
$230/Sq Ft
Est. Value
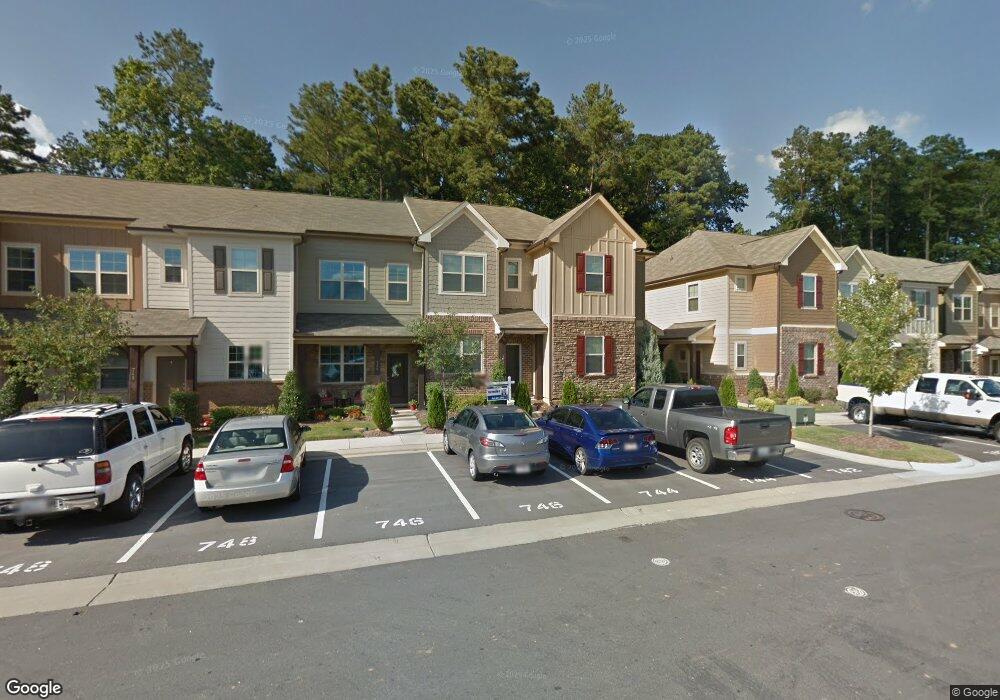
About This Home
This home is located at 744 Wickham Ridge Rd, Apex, NC 27539 and is currently estimated at $319,202, approximately $230 per square foot. 744 Wickham Ridge Rd is a home located in Wake County with nearby schools including Lufkin Road Middle School, Apex Friendship High School, and Pine Springs Prep Academy.
Ownership History
Date
Name
Owned For
Owner Type
Purchase Details
Closed on
Nov 6, 2018
Sold by
Laner James Harold
Bought by
Thomas Jeff David
Current Estimated Value
Home Financials for this Owner
Home Financials are based on the most recent Mortgage that was taken out on this home.
Original Mortgage
$164,000
Outstanding Balance
$103,019
Interest Rate
4.6%
Mortgage Type
New Conventional
Estimated Equity
$216,183
Purchase Details
Closed on
Aug 18, 2015
Sold by
Williams Rachel E
Bought by
Lauer James Harold
Home Financials for this Owner
Home Financials are based on the most recent Mortgage that was taken out on this home.
Original Mortgage
$168,000
Interest Rate
4.11%
Mortgage Type
New Conventional
Purchase Details
Closed on
Feb 14, 2013
Sold by
Ashton Raleigh Residential Llc
Bought by
Williams Rachel E
Home Financials for this Owner
Home Financials are based on the most recent Mortgage that was taken out on this home.
Original Mortgage
$153,061
Interest Rate
3.35%
Mortgage Type
New Conventional
Create a Home Valuation Report for This Property
The Home Valuation Report is an in-depth analysis detailing your home's value as well as a comparison with similar homes in the area
Purchase History
| Date | Buyer | Sale Price | Title Company |
|---|---|---|---|
| Thomas Jeff David | $205,000 | None Available | |
| Lauer James Harold | $168,000 | Attorney | |
| Williams Rachel E | $150,000 | None Available |
Source: Public Records
Mortgage History
| Date | Status | Borrower | Loan Amount |
|---|---|---|---|
| Open | Thomas Jeff David | $164,000 | |
| Previous Owner | Lauer James Harold | $168,000 | |
| Previous Owner | Williams Rachel E | $153,061 |
Source: Public Records
Tax History
| Year | Tax Paid | Tax Assessment Tax Assessment Total Assessment is a certain percentage of the fair market value that is determined by local assessors to be the total taxable value of land and additions on the property. | Land | Improvement |
|---|---|---|---|---|
| 2025 | $2,923 | $332,441 | $90,000 | $242,441 |
| 2024 | $2,857 | $332,441 | $90,000 | $242,441 |
Source: Public Records
Map
Nearby Homes
- 738 Wickham Ridge Rd
- 5501 Bobbitt Rd
- 694 Wickham Ridge Rd
- 680 Wickham Ridge Rd
- 213 October Glory Ln
- 104 Minnifer Ct
- 2344 Horton Park Dr
- 2340 Horton Park Dr
- 2336 Horton Park Dr
- 2353 Horton Park Dr
- 2332 Horton Park Dr
- 2349 Horton Park Dr
- 2345 Horton Park Dr
- 2333 Horton Park Dr
- 3340 Colby Chase Dr Unit Lot 2
- 2321 Horton Park Dr
- 3332 Colby Chase Dr Unit Lot 3
- 102 Gallent Hedge Trail
- 2408 Merion Creek Dr
- 2281 Horton Park Dr
- 746 Wickham Ridge Rd
- 748 Wickham Ridge Rd
- 748 Wickham Ridge Rd Unit 115
- 750 Wickham Ridge Rd
- 742 Wickham Ridge Rd
- 752 Wickham Ridge Rd
- 756 Wickham Ridge Rd
- 734 Wickham Ridge Rd
- 758 Wickham Ridge Rd
- 732 Wickham Ridge Rd
- 760 Wickham Ridge Rd
- 5417 Bobbitt Rd
- 730 Wickham Ridge Rd
- 5501 Bobbitt Rd Unit P 3058
- 762 Wickham Ridge Rd
- 728 Wickham Ridge Rd
- 764 Wickham Ridge Rd
- 764 Wickham Ridge Rd Unit 108
- 739 Wickham Ridge Rd
- 755 Wickham Ridge Rd
Your Personal Tour Guide
Ask me questions while you tour the home.