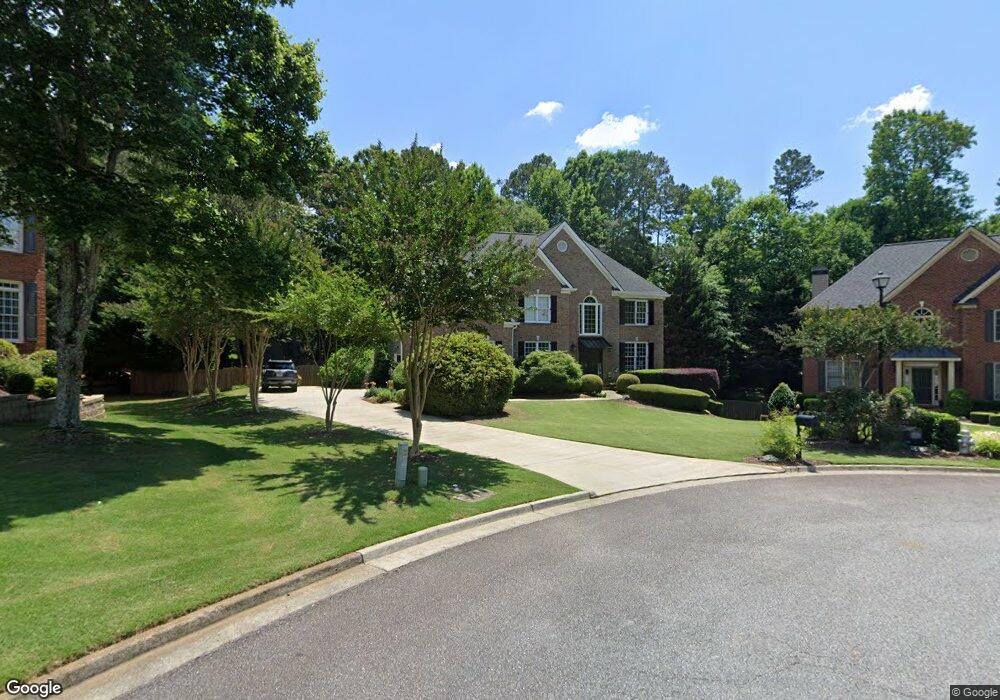
7440 Compton Cir Cumming, GA 30040
Estimated Value: $729,353 - $798,000
4
Beds
5
Baths
3,185
Sq Ft
$242/Sq Ft
Est. Value
About This Home
This home is located at 7440 Compton Cir, Cumming, GA 30040 and is currently estimated at $769,338, approximately $241 per square foot. 7440 Compton Cir is a home located in Forsyth County with nearby schools including Vickery Creek Middle School, West Forsyth High School, and Covenant Christian Academy.
Ownership History
Date
Name
Owned For
Owner Type
Purchase Details
Closed on
Jun 29, 2004
Sold by
Pittman Steven B and Pittman Tracy
Bought by
Clark Christopher P and Clark Julie
Current Estimated Value
Home Financials for this Owner
Home Financials are based on the most recent Mortgage that was taken out on this home.
Original Mortgage
$245,000
Outstanding Balance
$122,638
Interest Rate
6.25%
Mortgage Type
New Conventional
Estimated Equity
$646,700
Purchase Details
Closed on
Nov 26, 1997
Sold by
J V C Prop Inc
Bought by
Pittman Steven B and Pittman Tracy L
Home Financials for this Owner
Home Financials are based on the most recent Mortgage that was taken out on this home.
Original Mortgage
$197,000
Interest Rate
7.38%
Mortgage Type
New Conventional
Create a Home Valuation Report for This Property
The Home Valuation Report is an in-depth analysis detailing your home's value as well as a comparison with similar homes in the area
Home Values in the Area
Average Home Value in this Area
Purchase History
| Date | Buyer | Sale Price | Title Company |
|---|---|---|---|
| Clark Christopher P | $324,000 | -- | |
| Pittman Steven B | $227,200 | -- |
Source: Public Records
Mortgage History
| Date | Status | Borrower | Loan Amount |
|---|---|---|---|
| Open | Clark Christopher P | $245,000 | |
| Previous Owner | Pittman Steven B | $197,000 |
Source: Public Records
Tax History
| Year | Tax Paid | Tax Assessment Tax Assessment Total Assessment is a certain percentage of the fair market value that is determined by local assessors to be the total taxable value of land and additions on the property. | Land | Improvement |
|---|---|---|---|---|
| 2025 | $5,904 | $295,712 | $64,000 | $231,712 |
| 2024 | $5,904 | $296,716 | $60,000 | $236,716 |
| 2023 | $4,787 | $251,156 | $60,000 | $191,156 |
Source: Public Records
Map
Nearby Homes
- 7235 Compton Cir
- 7125 Compton Cir
- 7085 Burwick Ln
- 7105 Weybridge Dr
- 3690 Begonia Way
- 7050 Red Fox Ln
- 6320 Westerly Way
- 3590 Gardenside Ct
- 6920 Black Fox Ln
- 3580 Manor Court Dr
- 3750 Mustang Way
- 3795 Gardenside Ct
- 3810 Mustang Way
- 6425 Westbay Terrace
- 6705 Fox Creek Dr
- 7735 Oldbury Place
- 7590 Bromyard Terrace
- 1430 Estates Pointe
- 7140 Bridlefield Pass
- 3213 Balley Forrest Dr
- 7435 Compton Cir
- 6350 Black Oak Dr
- 7430 Compton Cir
- 7415 Compton Cir
- 7405 Regent Ct
- 6340 Black Oak Dr
- 6410 Black Oak Dr
- 7325 Compton Cir Unit 76
- 7325 Compton Cir
- 7415 Regent Ct
- 6420 Black Oak Dr
- 6330 Black Oak Dr
- 7320 Compton Cir
- 7315 Compton Cir
- 7425 Regent Ct
- 6405 Water Oak Ct
- 7310 Compton Cir
- 6430 Black Oak Dr
- 7295 Compton Cir
- 6320 Black Oak Dr Unit 3
Your Personal Tour Guide
Ask me questions while you tour the home.