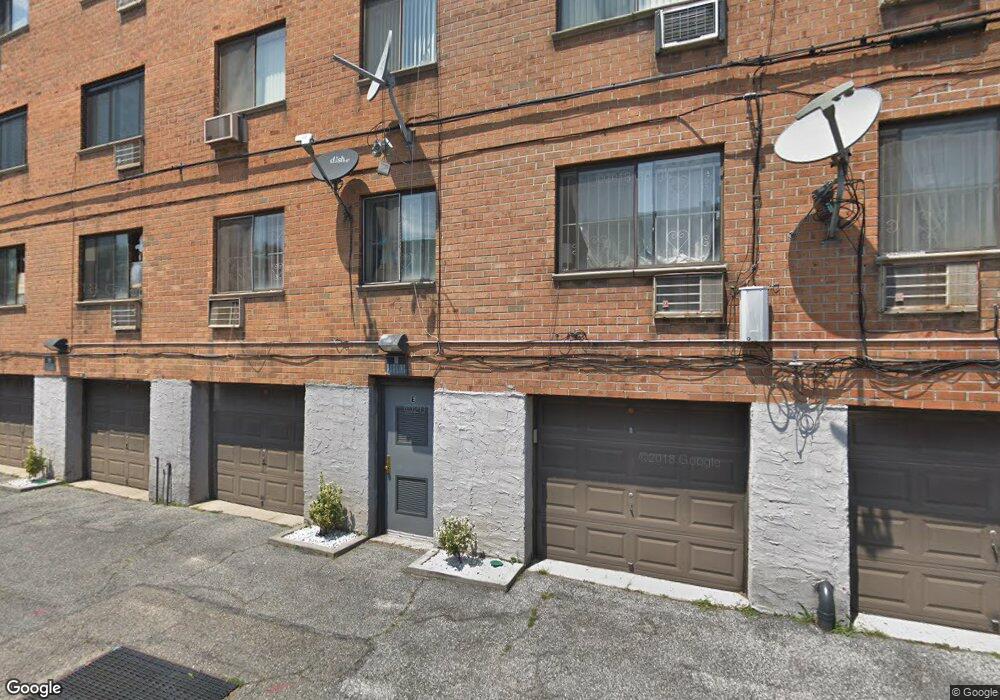
7443 Calamus Cir Unit 42 Elmhurst, NY 11373
Maspeth NeighborhoodEstimated Value: $655,000 - $850,000
--
Bed
--
Bath
1,104
Sq Ft
$678/Sq Ft
Est. Value
About This Home
This home is located at 7443 Calamus Cir Unit 42, Elmhurst, NY 11373 and is currently estimated at $748,987, approximately $678 per square foot. 7443 Calamus Cir Unit 42 is a home located in Queens County with nearby schools including P.S. 102 Bayview, IS 73 - The Frank Sansivieri School, and Newtown High School.
Ownership History
Date
Name
Owned For
Owner Type
Purchase Details
Closed on
Jun 18, 2010
Sold by
Chapur Beatriz E and Chapur Claudia A
Bought by
Chen Gong and Chen Xiao Fang
Current Estimated Value
Home Financials for this Owner
Home Financials are based on the most recent Mortgage that was taken out on this home.
Original Mortgage
$200,000
Outstanding Balance
$133,592
Interest Rate
4.98%
Mortgage Type
Purchase Money Mortgage
Estimated Equity
$615,395
Purchase Details
Closed on
Jul 9, 2008
Sold by
Chapur Beatriz and Chapur Ricardo
Bought by
Chapur Beatriz E and Chapur Claudia A
Create a Home Valuation Report for This Property
The Home Valuation Report is an in-depth analysis detailing your home's value as well as a comparison with similar homes in the area
Home Values in the Area
Average Home Value in this Area
Purchase History
| Date | Buyer | Sale Price | Title Company |
|---|---|---|---|
| Chen Gong | $380,000 | -- | |
| Chen Gong | $380,000 | -- | |
| Chapur Beatriz E | -- | -- | |
| Chapur Beatriz E | -- | -- |
Source: Public Records
Mortgage History
| Date | Status | Borrower | Loan Amount |
|---|---|---|---|
| Open | Chen Gong | $200,000 | |
| Closed | Chen Gong | $200,000 | |
| Closed | Chapur Beatriz E | $0 |
Source: Public Records
Tax History Compared to Growth
Tax History
| Year | Tax Paid | Tax Assessment Tax Assessment Total Assessment is a certain percentage of the fair market value that is determined by local assessors to be the total taxable value of land and additions on the property. | Land | Improvement |
|---|---|---|---|---|
| 2025 | $4,296 | $21,554 | $1,425 | $20,129 |
| 2024 | $4,296 | $21,389 | $1,585 | $19,804 |
| 2023 | $4,053 | $20,179 | $1,644 | $18,535 |
| 2022 | $3,607 | $39,873 | $3,483 | $36,390 |
| 2021 | $3,780 | $36,822 | $3,483 | $33,339 |
| 2020 | $3,802 | $29,583 | $3,483 | $26,100 |
| 2019 | $3,729 | $25,743 | $3,483 | $22,260 |
| 2018 | $3,428 | $16,816 | $2,405 | $14,411 |
| 2017 | $3,234 | $15,865 | $2,317 | $13,548 |
| 2016 | $2,992 | $15,865 | $2,317 | $13,548 |
| 2015 | $1,805 | $14,968 | $2,117 | $12,851 |
| 2014 | $1,805 | $14,854 | $2,317 | $12,537 |
Source: Public Records
Map
Nearby Homes
- 5119 Ireland St
- 74-29 Calamus Ave Unit 20
- 79-19 Calamus Ave
- 74-49 Calamus Ave Unit 51
- 74-47 Calamus Ave Unit 48
- 79-15 Kneeland Ave
- 73-37 52nd Ave
- 84-38 Grand Ave
- 0 Island Rd Unit S1604113
- 81-14 Queens Blvd Unit PH6C
- 79-10 Grand Ave
- 71-22 Calamus Ave
- 52-57 84th St
- 86-04 Grand Ave Unit 2D
- 78-06 46th Ave Unit 6C
- 78-06 46th Ave Unit 2
- 7408 46th Ave
- 5157 71st St
- 4607 79th St
- 51-21 Goldsmith St
- 7443 Calamus Cir Unit 41
- 7443 Calamus Cir Unit 40
- 7443 Calamus Cir Unit 42A
- 7441 Calamus Cir Unit 39
- 7441 Calamus Cir Unit 38
- 7441 Calamus Cir Unit 37
- 7445 Calamus Cir Unit 45
- 7445 Calamus Cir Unit 44
- 7445 Calamus Cir Unit 43
- 7439 Calamus Cir Unit 36
- 7439 Calamus Cir Unit 35
- 7439 Calamus Cir Unit 34
- 7439 Calamus Cir
- 7439 Calamus Cir Unit 36
- 7447 Calamus Cir Unit 48
- 7447 Calamus Cir Unit 47
- 7447 Calamus Cir Unit 46
- 7437 Calamus Cir Unit 32
- 74-49 Calamus Cir Unit 3rd FL
- 7449 Calamus Cir Unit 51