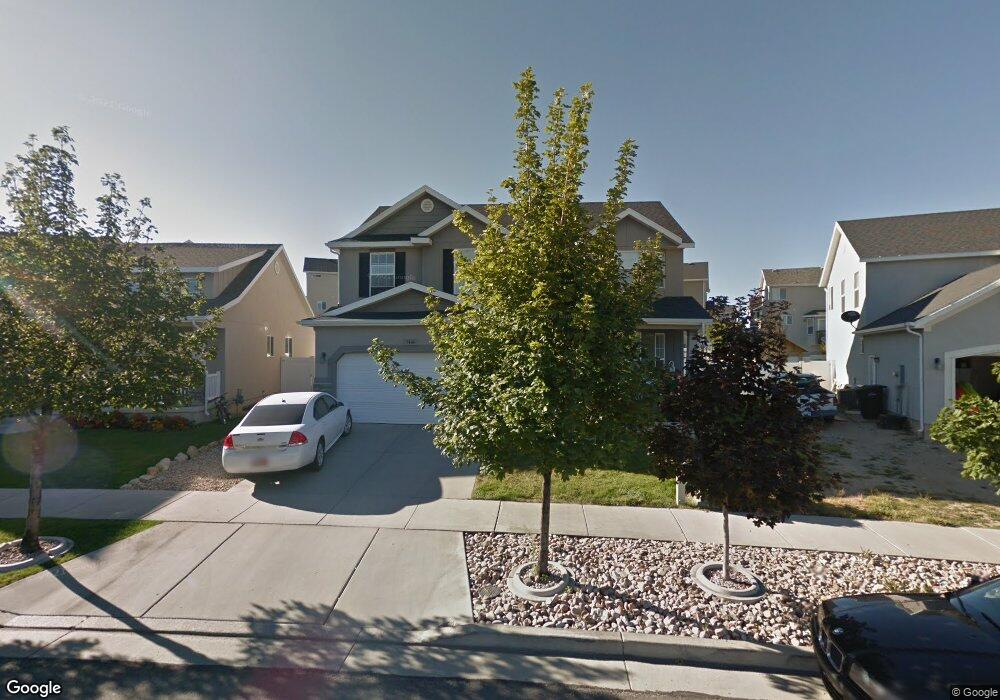
7446 S Park Maple Dr West Jordan, UT 84081
Jordan Hills NeighborhoodEstimated Value: $563,000 - $597,000
3
Beds
3
Baths
3,166
Sq Ft
$185/Sq Ft
Est. Value
About This Home
This home is located at 7446 S Park Maple Dr, West Jordan, UT 84081 and is currently estimated at $584,473, approximately $184 per square foot. 7446 S Park Maple Dr is a home located in Salt Lake County with nearby schools including Fox Hollow School, Sunset Ridge Middle School, and Copper Hills High School.
Ownership History
Date
Name
Owned For
Owner Type
Purchase Details
Closed on
Oct 4, 2012
Sold by
Federal Home Loan Mortgage Corporation
Bought by
Sadler Adam and Sadler Melanie A
Current Estimated Value
Home Financials for this Owner
Home Financials are based on the most recent Mortgage that was taken out on this home.
Original Mortgage
$231,800
Outstanding Balance
$161,419
Interest Rate
3.63%
Mortgage Type
New Conventional
Estimated Equity
$423,054
Purchase Details
Closed on
Nov 10, 2004
Sold by
Salisbury Development Lc
Bought by
Jensen Jeffery W and Jensen Tamara L
Home Financials for this Owner
Home Financials are based on the most recent Mortgage that was taken out on this home.
Original Mortgage
$210,151
Interest Rate
5.7%
Mortgage Type
FHA
Create a Home Valuation Report for This Property
The Home Valuation Report is an in-depth analysis detailing your home's value as well as a comparison with similar homes in the area
Home Values in the Area
Average Home Value in this Area
Purchase History
| Date | Buyer | Sale Price | Title Company |
|---|---|---|---|
| Sadler Adam | -- | Bonneville Superior Title | |
| Jensen Jeffery W | -- | Provo Land Title Company |
Source: Public Records
Mortgage History
| Date | Status | Borrower | Loan Amount |
|---|---|---|---|
| Open | Sadler Adam | $231,800 | |
| Previous Owner | Jensen Jeffery W | $210,151 |
Source: Public Records
Tax History Compared to Growth
Tax History
| Year | Tax Paid | Tax Assessment Tax Assessment Total Assessment is a certain percentage of the fair market value that is determined by local assessors to be the total taxable value of land and additions on the property. | Land | Improvement |
|---|---|---|---|---|
| 2025 | $3,064 | $566,400 | $152,400 | $414,000 |
| 2024 | $3,064 | $539,500 | $146,500 | $393,000 |
| 2023 | $3,103 | $513,800 | $140,900 | $372,900 |
| 2022 | $3,294 | $542,000 | $138,200 | $403,800 |
| 2021 | $2,903 | $441,800 | $106,300 | $335,500 |
| 2020 | $2,696 | $383,900 | $98,600 | $285,300 |
| 2019 | $2,664 | $371,500 | $93,000 | $278,500 |
| 2018 | $2,498 | $344,500 | $93,000 | $251,500 |
| 2017 | $2,384 | $325,300 | $93,000 | $232,300 |
| 2016 | $2,496 | $320,300 | $86,100 | $234,200 |
| 2015 | $2,116 | $263,000 | $92,600 | $170,400 |
| 2014 | $2,062 | $251,900 | $89,700 | $162,200 |
Source: Public Records
Map
Nearby Homes
- 7474 S Sunset Maple Dr
- 6777 Grevillea Ln
- 6934 Pointe Cedar Ln Unit 330
- 7613 Oak Hallow Rd Unit 325
- 6938 Pointe Cedar Ln Unit 331
- 6969 W Hidden Hills Way
- 6973 W Hidden Hills Way Unit 146
- 6973 W Hidden Hills Way
- 6793 Tupelo Ln
- 6988 W Hidden Hills Way Unit 180
- 7577 S New Sycamore Dr
- 6977 Farnsworth Peak Dr Unit 311
- 7034 W Terraine Rd
- 7668 Clipper Hill Rd Unit 307
- 6989 Farnsworth Peak Dr Unit 310
- 6997 Farnsworth Peak Dr Unit 309
- 7048 W Terraine Rd Unit 160
- 7056 W Terraine Rd Unit 161
- 7587 S Bear Gulch Rd Unit 162
- 7062 W Terraine Rd Unit 162
- 7446 Park Maple Dr
- 7442 Park Maple Dr
- 7454 Park Maple Dr
- 6737 W Sunset Maple Dr
- 6737 Sunset Maple Dr
- 7429 Sunset Maple Dr
- 7437 S Sunset Maple Dr
- 7437 Sunset Maple Dr
- 6733 W Sunset Maple Dr
- 7458 Park Maple Dr
- 6733 Sunset Maple Dr
- 7458 S Park Maple Dr
- 7447 Sunset Maple Dr
- 7461 Park Maple Dr
- 7461 S Park Maple Dr
- 7451 S Sunset Maple Dr
- 7451 Sunset Maple Dr
- 7464 Park Maple Dr
- 7473 Park Maple Dr
- 7473 S Park Maple Dr