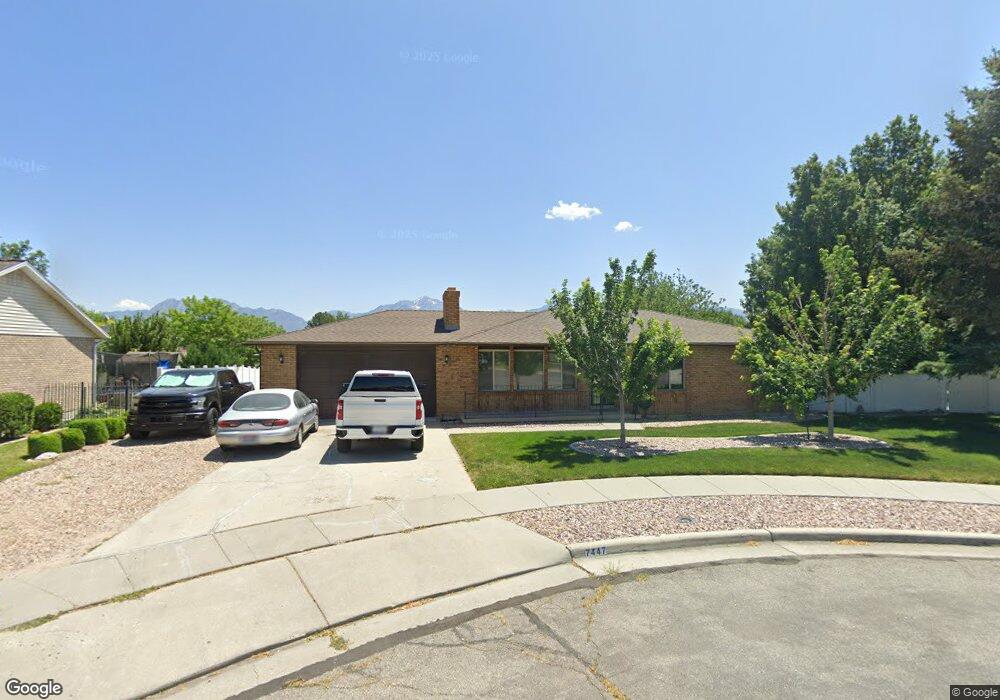
7447 S 2405 W West Jordan, UT 84084
Estimated Value: $524,000 - $565,000
4
Beds
2
Baths
2,336
Sq Ft
$233/Sq Ft
Est. Value
About This Home
This home is located at 7447 S 2405 W, West Jordan, UT 84084 and is currently estimated at $544,648, approximately $233 per square foot. 7447 S 2405 W is a home located in Salt Lake County with nearby schools including West Jordan School, Westland Elementary School, and West Jordan Middle School.
Ownership History
Date
Name
Owned For
Owner Type
Purchase Details
Closed on
Nov 26, 2013
Sold by
Oviatt Matt
Bought by
Snow Jeremy L
Current Estimated Value
Home Financials for this Owner
Home Financials are based on the most recent Mortgage that was taken out on this home.
Original Mortgage
$205,311
Outstanding Balance
$153,698
Interest Rate
4.25%
Mortgage Type
FHA
Estimated Equity
$390,950
Purchase Details
Closed on
Jun 27, 2013
Sold by
Sabol Helen
Bought by
Oviatt Matt
Purchase Details
Closed on
May 21, 2003
Sold by
Sabol Helen and Leamon Helen S
Bought by
Sabol Helen
Home Financials for this Owner
Home Financials are based on the most recent Mortgage that was taken out on this home.
Original Mortgage
$100,000
Interest Rate
5.75%
Mortgage Type
Purchase Money Mortgage
Purchase Details
Closed on
Nov 22, 1995
Sold by
Leamon Mark A and Leamon Helen S
Bought by
Leamon Helen S
Create a Home Valuation Report for This Property
The Home Valuation Report is an in-depth analysis detailing your home's value as well as a comparison with similar homes in the area
Home Values in the Area
Average Home Value in this Area
Purchase History
| Date | Buyer | Sale Price | Title Company |
|---|---|---|---|
| Snow Jeremy L | -- | Richland Title Ins Agency | |
| Oviatt Matt | -- | Monument Title Ins Co | |
| Sabol Helen | -- | First American Title | |
| Leamon Helen S | -- | -- |
Source: Public Records
Mortgage History
| Date | Status | Borrower | Loan Amount |
|---|---|---|---|
| Open | Snow Jeremy L | $205,311 | |
| Previous Owner | Sabol Helen | $100,000 |
Source: Public Records
Tax History Compared to Growth
Tax History
| Year | Tax Paid | Tax Assessment Tax Assessment Total Assessment is a certain percentage of the fair market value that is determined by local assessors to be the total taxable value of land and additions on the property. | Land | Improvement |
|---|---|---|---|---|
| 2025 | $2,567 | $511,000 | $148,500 | $362,500 |
| 2024 | $2,567 | $493,900 | $143,300 | $350,600 |
| 2023 | $2,416 | $438,100 | $136,400 | $301,700 |
| 2022 | $2,507 | $447,200 | $133,800 | $313,400 |
| 2021 | $2,100 | $341,000 | $109,100 | $231,900 |
| 2020 | $1,967 | $299,800 | $109,100 | $190,700 |
| 2019 | $1,979 | $295,700 | $109,100 | $186,600 |
| 2018 | $1,856 | $275,100 | $82,400 | $192,700 |
| 2017 | $1,732 | $255,600 | $82,400 | $173,200 |
| 2016 | $1,715 | $237,800 | $82,400 | $155,400 |
| 2015 | $1,660 | $224,400 | $94,100 | $130,300 |
| 2014 | $1,593 | $212,000 | $89,600 | $122,400 |
Source: Public Records
Map
Nearby Homes
- 2510 W Jordan Meadows Ln
- 2573 Jordan Meadows Ln
- 7361 S 2700 W
- 7647 S 2500 W
- 2386 W 7680 S
- 2169 W 7600 S
- 2312 W Hidden Bend Cove Unit 107
- 2062 W 7705 S
- 7645 S 1960 W
- 2886 W 7550 S
- 1951 W 7125 S
- 7150 Camelot Way
- 7721 Sunset Cir
- 7149 S Camelot Way
- 1829 W 7600 S Unit G301
- 2421 W 6900 S
- 1817 W 7600 S Unit I204
- 7279 S Kenadi Ct
- 6918 S Harvest Cir
- 1801 W 7600 S Unit C201
- 7453 S 2405 W
- 7435 S 2405 W
- 7448 S 2345 W
- 7460 S 2345 W
- 7436 S 2345 W
- 2382 W Jordan Meadows Ln
- 2382 Jordan Meadows Ln
- 7454 S 2405 W
- 2379 W 7410 S
- 7476 S 2345 W
- 7448 S 2405 W
- 2359 W 7410 S
- 7436 S 2405 W
- 2406 Jordan Meadows Ln
- 2419 W 7410 S
- 7455 S 2345 W
- 7433 S 2345 W
- 2430 Jordan Meadows Ln
- 2444 W 7410 S
- 7469 S 2345 W