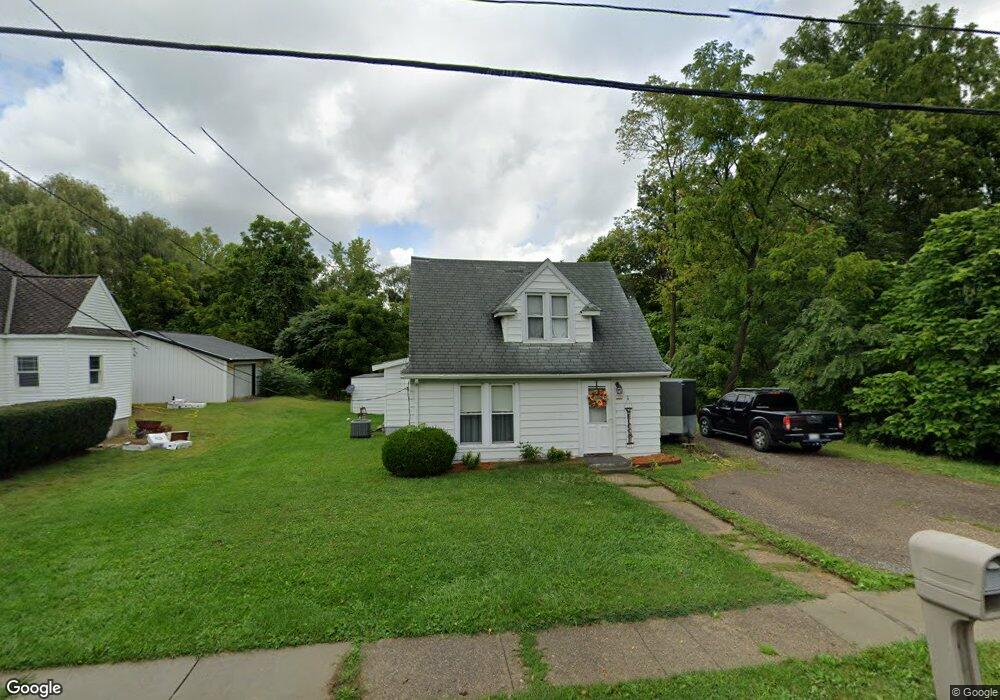
74478 34th Ave Covert, MI 49043
Estimated Value: $104,000 - $166,000
3
Beds
1
Bath
1,560
Sq Ft
$89/Sq Ft
Est. Value
About This Home
This home is located at 74478 34th Ave, Covert, MI 49043 and is currently estimated at $138,476, approximately $88 per square foot. 74478 34th Ave is a home located in Van Buren County with nearby schools including Covert Elementary School, Covert Middle School, and Covert High School.
Ownership History
Date
Name
Owned For
Owner Type
Purchase Details
Closed on
Dec 28, 2022
Sold by
Cortes David
Bought by
Cortez Daniel and Cortez Nohemi
Current Estimated Value
Purchase Details
Closed on
Sep 11, 2014
Sold by
Shafer Jeffrey Joseph and Wellington Crystal Lynn
Bought by
Cortez David
Purchase Details
Closed on
Jul 7, 2014
Sold by
Richard J Mcfadden Trust
Bought by
Shafer Jeffrey Joseph and Wellington Crystal Lynn
Purchase Details
Closed on
Aug 12, 2004
Sold by
Federal Home Loan Mortgage Corporation
Bought by
Mcfadden Richard J and Richard J Mcfadden Trust
Purchase Details
Closed on
Feb 4, 2004
Sold by
Abn Amro Mortgage Group Inc
Bought by
Federal Home Loan Mortgage Corporation
Purchase Details
Closed on
Feb 2, 2004
Sold by
Robinson Gail and Robinson Gail F
Bought by
Federal Home Loan Mortgage Corporation
Purchase Details
Closed on
Aug 24, 2001
Sold by
Davis Frederick
Bought by
Robison Gail F
Purchase Details
Closed on
Feb 21, 2000
Sold by
Jackson Deborah
Bought by
Davis Frederick
Create a Home Valuation Report for This Property
The Home Valuation Report is an in-depth analysis detailing your home's value as well as a comparison with similar homes in the area
Home Values in the Area
Average Home Value in this Area
Purchase History
| Date | Buyer | Sale Price | Title Company |
|---|---|---|---|
| Cortez Daniel | $28,000 | -- | |
| Cortez David | -- | None Available | |
| Shafer Jeffrey Joseph | $58,000 | None Available | |
| Mcfadden Richard J | $34,650 | -- | |
| Federal Home Loan Mortgage Corporation | -- | -- | |
| Federal Home Loan Mortgage Corporation | $3,500 | -- | |
| Robison Gail F | -- | -- | |
| Davis Frederick | $10,000 | -- |
Source: Public Records
Tax History Compared to Growth
Tax History
| Year | Tax Paid | Tax Assessment Tax Assessment Total Assessment is a certain percentage of the fair market value that is determined by local assessors to be the total taxable value of land and additions on the property. | Land | Improvement |
|---|---|---|---|---|
| 2025 | $723 | $60,500 | $0 | $0 |
| 2024 | $307 | $66,400 | $0 | $0 |
| 2023 | $293 | $50,300 | $0 | $0 |
| 2022 | $1,386 | $33,100 | $0 | $0 |
| 2021 | $1,429 | $26,600 | $1,400 | $25,200 |
| 2020 | $1,143 | $26,600 | $1,400 | $25,200 |
| 2019 | $1,517 | $26,300 | $26,300 | $0 |
| 2018 | $1,478 | $23,800 | $23,800 | $0 |
| 2017 | $1,277 | $19,300 | $0 | $0 |
| 2016 | $1,201 | $19,300 | $0 | $0 |
| 2015 | $644 | $19,300 | $0 | $0 |
| 2014 | $703 | $19,400 | $0 | $0 |
| 2013 | -- | $25,700 | $25,700 | $0 |
Source: Public Records
Map
Nearby Homes