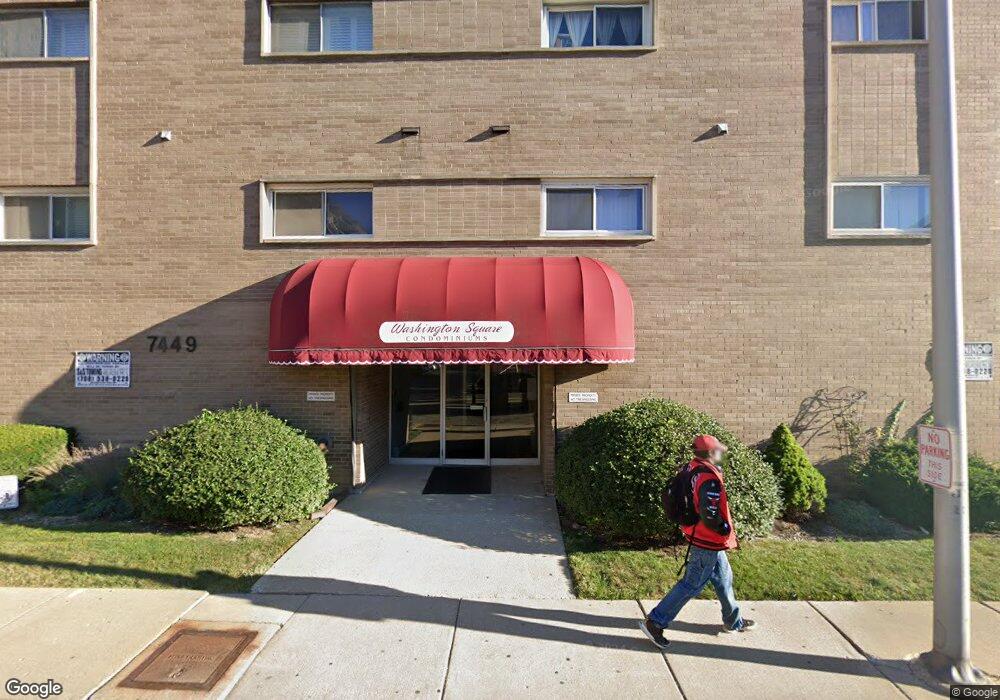
7449 Washington St Unit 406 Forest Park, IL 60130
Estimated Value: $121,000 - $132,000
1
Bed
1
Bath
705
Sq Ft
$179/Sq Ft
Est. Value
About This Home
This home is located at 7449 Washington St Unit 406, Forest Park, IL 60130 and is currently estimated at $126,073, approximately $178 per square foot. 7449 Washington St Unit 406 is a home located in Cook County with nearby schools including Garfield Elementary School, Field Stevenson Elementary School, and Forest Park Middle School.
Ownership History
Date
Name
Owned For
Owner Type
Purchase Details
Closed on
Oct 29, 2007
Sold by
Browning Flowers Vonsholiona V
Bought by
Flowers Roy D
Current Estimated Value
Purchase Details
Closed on
Sep 25, 2006
Sold by
Shade Michele L
Bought by
Flowers Roy and Browning Flowers Vonsholiona
Home Financials for this Owner
Home Financials are based on the most recent Mortgage that was taken out on this home.
Original Mortgage
$120,000
Interest Rate
10.55%
Mortgage Type
Unknown
Purchase Details
Closed on
Oct 29, 2001
Sold by
Baldoceda Carlos G
Bought by
Shade Michele L
Home Financials for this Owner
Home Financials are based on the most recent Mortgage that was taken out on this home.
Original Mortgage
$58,425
Interest Rate
6.69%
Purchase Details
Closed on
Mar 1, 2001
Sold by
Fellers Karen and Cairo Karen
Bought by
Baldoceda Carlos
Create a Home Valuation Report for This Property
The Home Valuation Report is an in-depth analysis detailing your home's value as well as a comparison with similar homes in the area
Home Values in the Area
Average Home Value in this Area
Purchase History
| Date | Buyer | Sale Price | Title Company |
|---|---|---|---|
| Flowers Roy D | -- | Chicago Title Insurance Co | |
| Flowers Roy | $120,000 | First American Title | |
| Shade Michele L | $61,500 | -- | |
| Baldoceda Carlos | $57,000 | -- |
Source: Public Records
Mortgage History
| Date | Status | Borrower | Loan Amount |
|---|---|---|---|
| Previous Owner | Flowers Roy | $120,000 | |
| Previous Owner | Shade Michele L | $58,425 |
Source: Public Records
Tax History Compared to Growth
Tax History
| Year | Tax Paid | Tax Assessment Tax Assessment Total Assessment is a certain percentage of the fair market value that is determined by local assessors to be the total taxable value of land and additions on the property. | Land | Improvement |
|---|---|---|---|---|
| 2024 | $1,702 | $8,985 | $285 | $8,700 |
| 2023 | $1,324 | $8,985 | $285 | $8,700 |
| 2022 | $1,324 | $7,115 | $321 | $6,794 |
| 2021 | $1,288 | $7,114 | $320 | $6,794 |
| 2020 | $1,331 | $7,114 | $320 | $6,794 |
| 2019 | $1,411 | $7,438 | $292 | $7,146 |
| 2018 | $1,617 | $8,125 | $292 | $7,833 |
| 2017 | $1,602 | $8,125 | $292 | $7,833 |
| 2016 | $729 | $4,532 | $263 | $4,269 |
| 2015 | $673 | $4,532 | $263 | $4,269 |
| 2014 | $680 | $4,532 | $263 | $4,269 |
| 2013 | $1,032 | $5,820 | $263 | $5,557 |
Source: Public Records
Map
Nearby Homes
- 7449 Washington St Unit 207
- 7421 Washington St
- 310 Lathrop Ave Unit P52
- 314 Lathrop Ave Unit 502
- 314 Lathrop Ave Unit 604
- 314 Lathrop Ave Unit 507
- 300 Circle Ave Unit 4C
- 7415 Dixon St
- 315 Marengo Ave Unit 2H
- 133 Ashland Ave
- 213 Ashland Ave
- 7251 Randolph St Unit C6
- 7243 Madison St Unit 409
- 443 Ferdinand Ave
- 442 Hannah Ave
- 500 Beloit Ave Unit A2
- 7240 Franklin St Unit 2A
- 7241 Franklin St Unit B
- 428 Elgin Ave
- 344 S Maple Ave Unit 3B
- 7449 Washington St Unit 303
- 7449 Washington St Unit 105
- 7449 Washington St Unit 308
- 7449 Washington St Unit 208
- 7449 Washington St Unit 604
- 7449 Washington St Unit 205
- 7449 Washington St Unit 405
- 7449 Washington St Unit 203
- 7449 Washington St Unit 607
- 7449 Washington St Unit 302
- 7449 Washington St Unit 407
- 7449 Washington St Unit 401
- 7449 Washington St Unit 202
- 7449 Washington St Unit 106
- 7449 Washington St Unit 603
- 7449 Washington St Unit 108
- 7449 Washington St Unit 501
- 7449 Washington St Unit 608
- 7449 Washington St Unit 602
- 7449 Washington St Unit 306