745 10th St Richmond, CA 94801
Iron Triangle NeighborhoodEstimated Value: $488,000 - $549,000
3
Beds
2
Baths
1,216
Sq Ft
$428/Sq Ft
Est. Value
About This Home
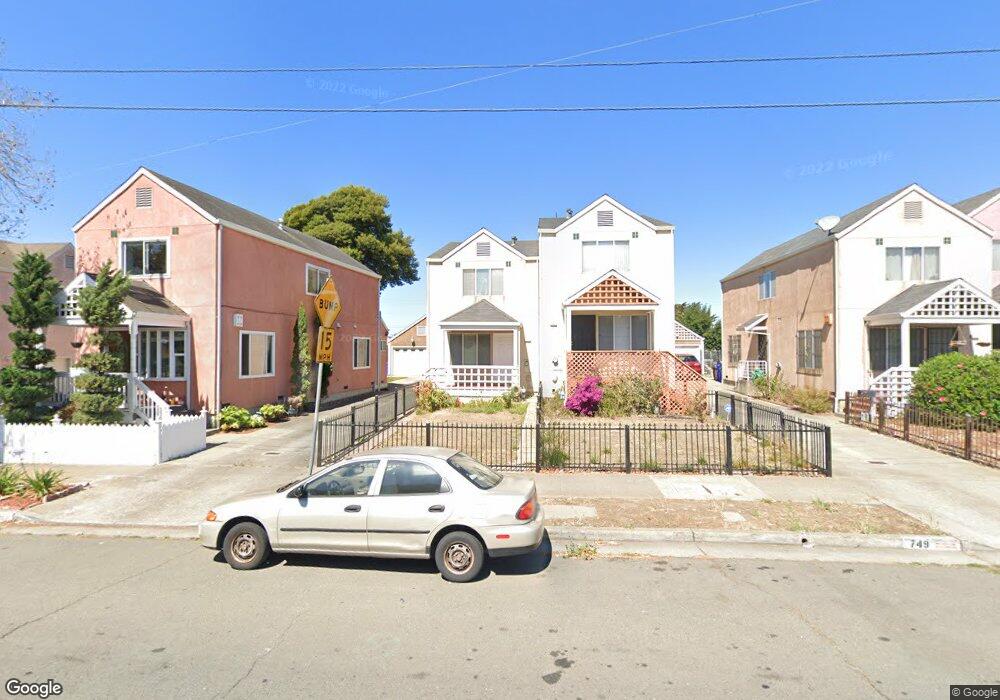
This home is located at 745 10th St, Richmond, CA 94801 and is currently estimated at $520,333, approximately $427 per square foot. 745 10th St is a home located in Contra Costa County with nearby schools including Peres Elementary School, Walter T. Helms Middle School, and Richmond High School.
Ownership History
Date
Name
Owned For
Owner Type
Purchase Details
Closed on
Sep 4, 1996
Sold by
West County Housing Corp
Bought by
Solano Oscar Ivan and Solano Petrona R
Current Estimated Value
Home Financials for this Owner
Home Financials are based on the most recent Mortgage that was taken out on this home.
Original Mortgage
$102,147
Outstanding Balance
$8,795
Interest Rate
8.23%
Mortgage Type
FHA
Estimated Equity
$511,538
Create a Home Valuation Report for This Property
The Home Valuation Report is an in-depth analysis detailing your home's value as well as a comparison with similar homes in the area
Home Values in the Area
Average Home Value in this Area
Purchase History
We collect this data history from publicly available records. To have your information removed, we recommend requesting removal directly through your county’s website.
| Date | Buyer | Sale Price | Title Company |
|---|---|---|---|
| Solano Oscar Ivan | $115,000 | Chicago Title Co |
Source: Public Records
Mortgage History
We collect this data history from publicly available records. To have your information removed, we recommend requesting removal directly through your county’s website.
| Date | Status | Borrower | Loan Amount |
|---|---|---|---|
| Open | Solano Oscar Ivan | $102,147 |
Source: Public Records
Tax History
| Year | Tax Paid | Tax Assessment Tax Assessment Total Assessment is a certain percentage of the fair market value that is determined by local assessors to be the total taxable value of land and additions on the property. | Land | Improvement |
|---|---|---|---|---|
| 2025 | $4,071 | $187,274 | $42,334 | $144,940 |
| 2024 | $3,960 | $183,603 | $41,504 | $142,099 |
| 2023 | $3,960 | $180,004 | $40,691 | $139,313 |
| 2022 | $3,858 | $176,476 | $39,894 | $136,582 |
| 2021 | $3,784 | $173,016 | $39,112 | $133,904 |
| 2019 | $3,544 | $167,885 | $37,952 | $129,933 |
| 2018 | $3,411 | $164,594 | $37,208 | $127,386 |
| 2017 | $3,317 | $161,368 | $36,479 | $124,889 |
| 2016 | $3,245 | $158,205 | $35,764 | $122,441 |
| 2015 | $3,203 | $155,829 | $35,227 | $120,602 |
| 2014 | $3,176 | $152,777 | $34,537 | $118,240 |
Source: Public Records
Map
Nearby Homes
Your Personal Tour Guide
Ask me questions while you tour the home.