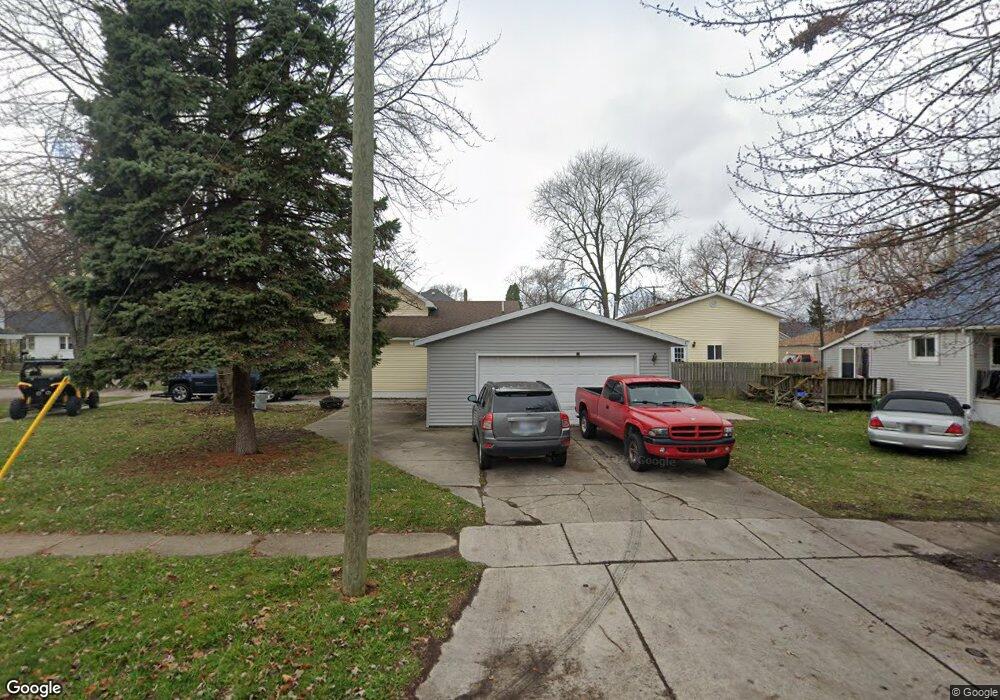
745 15th St Port Huron, MI 48060
Estimated Value: $121,000 - $140,000
2
Beds
1
Bath
1,055
Sq Ft
$121/Sq Ft
Est. Value
About This Home
This home is located at 745 15th St, Port Huron, MI 48060 and is currently estimated at $128,126, approximately $121 per square foot. 745 15th St is a home located in St. Clair County with nearby schools including Michigamme Elementary School, Central Middle School, and Port Huron High School.
Ownership History
Date
Name
Owned For
Owner Type
Purchase Details
Closed on
Oct 23, 2018
Sold by
Leroy Scharnakau Martin
Bought by
Scharnakau Martin Leroy
Current Estimated Value
Purchase Details
Closed on
Dec 31, 2009
Sold by
Cf Bancorp Mortgage
Bought by
Scharnakau Martin L
Home Financials for this Owner
Home Financials are based on the most recent Mortgage that was taken out on this home.
Original Mortgage
$21,850
Interest Rate
4.84%
Mortgage Type
New Conventional
Purchase Details
Closed on
Jan 22, 2009
Sold by
Lynch Annette M
Bought by
Cf Bancorp Mortgage Company and Citizens First Mortgage Llc
Purchase Details
Closed on
Apr 30, 2007
Sold by
Provo Steven J
Bought by
Lynch Annette M
Purchase Details
Closed on
Jul 19, 2006
Sold by
Lynch Annette M
Bought by
Lynch Anneette M and Provo Steven J
Create a Home Valuation Report for This Property
The Home Valuation Report is an in-depth analysis detailing your home's value as well as a comparison with similar homes in the area
Home Values in the Area
Average Home Value in this Area
Purchase History
| Date | Buyer | Sale Price | Title Company |
|---|---|---|---|
| Scharnakau Martin Leroy | -- | None Listed On Document | |
| Scharnakau Martin L | $23,000 | Cfs Title Insurance Agency | |
| Cf Bancorp Mortgage Company | $64,000 | None Available | |
| Lynch Annette M | -- | None Available | |
| Lynch Anneette M | -- | None Available |
Source: Public Records
Mortgage History
| Date | Status | Borrower | Loan Amount |
|---|---|---|---|
| Previous Owner | Scharnakau Martin L | $21,850 |
Source: Public Records
Tax History Compared to Growth
Tax History
| Year | Tax Paid | Tax Assessment Tax Assessment Total Assessment is a certain percentage of the fair market value that is determined by local assessors to be the total taxable value of land and additions on the property. | Land | Improvement |
|---|---|---|---|---|
| 2025 | $1,265 | $56,700 | $0 | $0 |
| 2024 | $1,023 | $54,100 | $0 | $0 |
| 2023 | $966 | $49,100 | $0 | $0 |
| 2022 | $952 | $42,600 | $0 | $0 |
| 2021 | $904 | $36,700 | $0 | $0 |
| 2020 | $914 | $33,600 | $33,600 | $0 |
| 2019 | $898 | $24,400 | $0 | $0 |
| 2018 | $878 | $24,400 | $0 | $0 |
| 2017 | $786 | $21,100 | $0 | $0 |
| 2016 | $661 | $21,100 | $0 | $0 |
| 2015 | $649 | $19,100 | $19,100 | $0 |
| 2014 | $649 | $18,100 | $18,100 | $0 |
| 2013 | -- | $18,100 | $0 | $0 |
Source: Public Records
Map
Nearby Homes