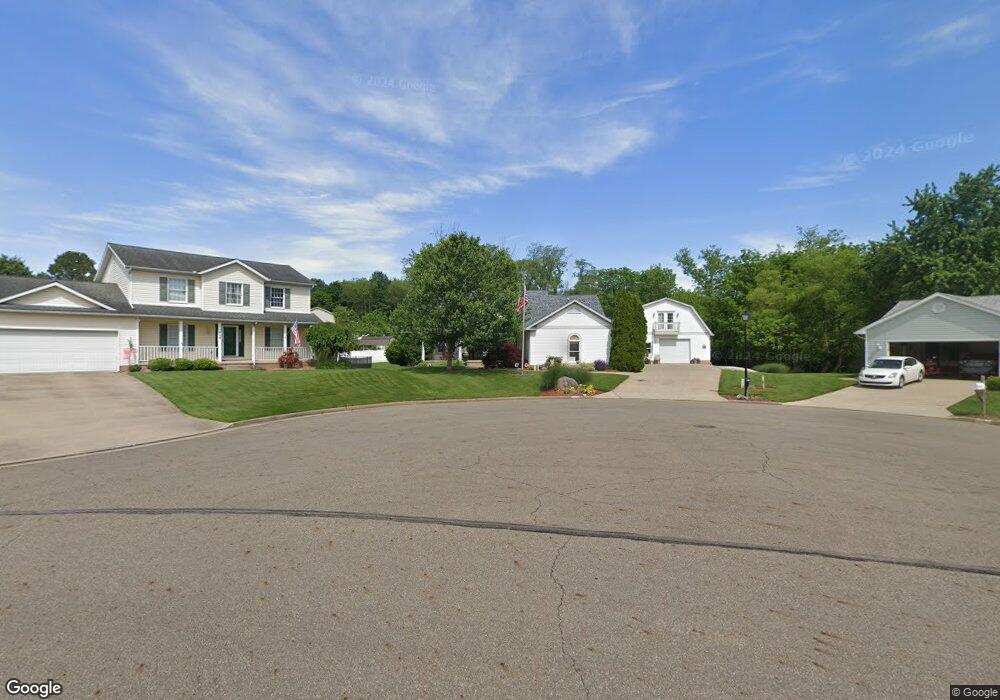
745 28th St NW Massillon, OH 44647
West Brookfield NeighborhoodEstimated Value: $309,000 - $374,000
3
Beds
2
Baths
2,244
Sq Ft
$152/Sq Ft
Est. Value
About This Home
This home is located at 745 28th St NW, Massillon, OH 44647 and is currently estimated at $340,069, approximately $151 per square foot. 745 28th St NW is a home located in Stark County with nearby schools including Massillon Intermediate School, Massillon Junior High School, and Washington High School.
Ownership History
Date
Name
Owned For
Owner Type
Purchase Details
Closed on
Jun 21, 2017
Sold by
Glick Thelma L
Bought by
Tobin Karen F
Current Estimated Value
Purchase Details
Closed on
May 4, 2010
Sold by
Glick Earl and Glick Thelma
Bought by
Glick Earl J and Glick Thelma L
Create a Home Valuation Report for This Property
The Home Valuation Report is an in-depth analysis detailing your home's value as well as a comparison with similar homes in the area
Home Values in the Area
Average Home Value in this Area
Purchase History
| Date | Buyer | Sale Price | Title Company |
|---|---|---|---|
| Tobin Karen F | -- | None Available | |
| Glick Earl J | -- | Attorney |
Source: Public Records
Tax History Compared to Growth
Tax History
| Year | Tax Paid | Tax Assessment Tax Assessment Total Assessment is a certain percentage of the fair market value that is determined by local assessors to be the total taxable value of land and additions on the property. | Land | Improvement |
|---|---|---|---|---|
| 2025 | $6,815 | $122,370 | $21,250 | $101,120 |
| 2024 | -- | $127,370 | $21,250 | $106,120 |
| 2023 | $12,236 | $102,410 | $17,220 | $85,190 |
| 2022 | $5,246 | $102,410 | $17,220 | $85,190 |
| 2021 | $5,331 | $102,410 | $17,220 | $85,190 |
| 2020 | $4,620 | $83,450 | $14,110 | $69,340 |
| 2019 | $4,554 | $83,450 | $14,110 | $69,340 |
| 2018 | $4,527 | $83,450 | $14,110 | $69,340 |
| 2017 | $4,602 | $77,290 | $15,510 | $61,780 |
| 2016 | $4,679 | $77,290 | $15,510 | $61,780 |
| 2015 | $4,623 | $77,290 | $15,510 | $61,780 |
| 2014 | $404 | $71,160 | $14,250 | $56,910 |
| 2013 | $2,209 | $71,160 | $14,250 | $56,910 |
Source: Public Records
Map
Nearby Homes
- 2790 Lee Ave NW
- 2527 Lincoln Way NW
- 3069 Castle West Cir NW
- 3130 Lincoln Way W
- 830 Standish Cir NW
- 540 Carver St NW
- 822 32nd St NW
- 429 18th St NW
- 1725 Auburn Ave NW
- 10225 Wooster St NW
- 309 15th St NW
- 860 17th St NW
- 852 15th St NW
- 1835 Main Ave W
- 728 Hillside Place SW
- 1301 Lincoln Way NW
- 2760 Relda Cir SW
- 104 16th St SW
- 2488 Carlene Ave SW
- 1605 Tremont Ave SW
- 735 28th St NW
- 755 28th St NW
- 2820 Poplar St NW
- 2824 Poplar St NW
- 725 28th St NW
- 2814 Poplar St NW
- 759 28th St NW
- 740 28th St NW
- 2830 Poplar St NW
- 720 28th St NW
- 2810 Lee Ave NW
- 765 28th St NW
- 2820 Lee Ave NW
- 2821 Poplar St NW
- 760 28th St NW
- 2831 Poplar St NW
- 2834 Poplar St NW
- 2811 Poplar St NW
- 775 28th St NW
- 2782 Lee Ave NW