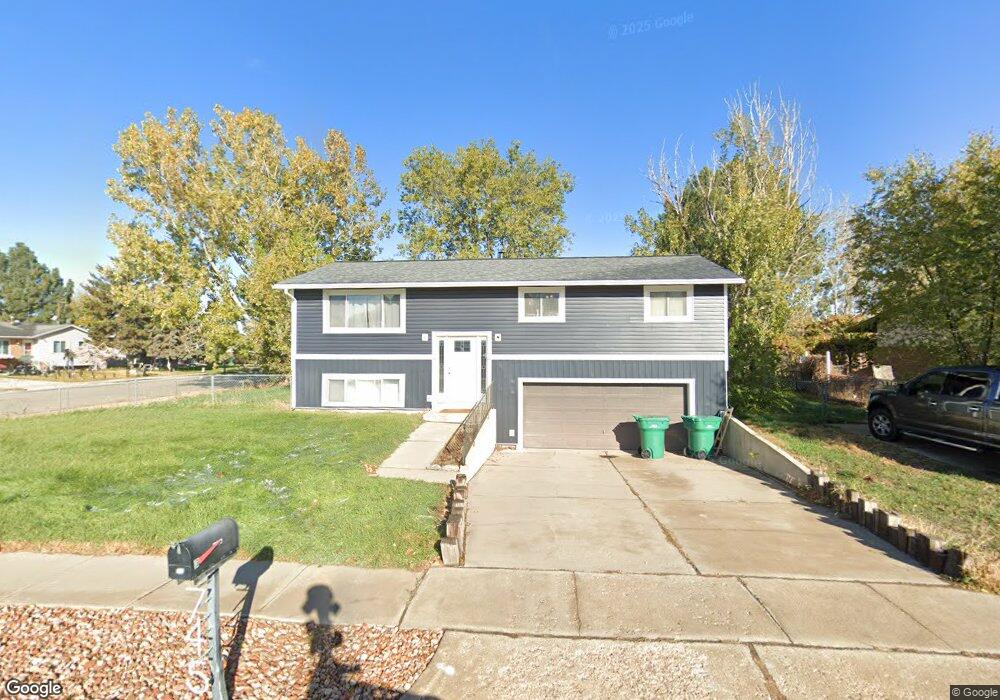
745 Barlow St Clearfield, UT 84015
Estimated Value: $346,000 - $399,947
3
Beds
1
Bath
1,591
Sq Ft
$236/Sq Ft
Est. Value
About This Home
This home is located at 745 Barlow St, Clearfield, UT 84015 and is currently estimated at $375,237, approximately $235 per square foot. 745 Barlow St is a home located in Davis County with nearby schools including Doxey School, North Davis Junior High School, and Clearfield High School.
Ownership History
Date
Name
Owned For
Owner Type
Purchase Details
Closed on
Jun 9, 2016
Sold by
Miller Doug
Bought by
Johndrow Patrick Blaine
Current Estimated Value
Purchase Details
Closed on
Oct 13, 2012
Sold by
Miller Douglas W
Bought by
Rawlings Julie
Purchase Details
Closed on
Sep 25, 2001
Sold by
Buchanan Gerald K
Bought by
Miller Douglas W
Home Financials for this Owner
Home Financials are based on the most recent Mortgage that was taken out on this home.
Original Mortgage
$97,962
Interest Rate
6.91%
Mortgage Type
FHA
Create a Home Valuation Report for This Property
The Home Valuation Report is an in-depth analysis detailing your home's value as well as a comparison with similar homes in the area
Home Values in the Area
Average Home Value in this Area
Purchase History
| Date | Buyer | Sale Price | Title Company |
|---|---|---|---|
| Johndrow Patrick Blaine | -- | Mountain View Title | |
| Rawlings Julie | -- | None Available | |
| Miller Douglas W | -- | Bonneville Title Company Inc |
Source: Public Records
Mortgage History
| Date | Status | Borrower | Loan Amount |
|---|---|---|---|
| Previous Owner | Miller Douglas W | $97,962 |
Source: Public Records
Tax History Compared to Growth
Tax History
| Year | Tax Paid | Tax Assessment Tax Assessment Total Assessment is a certain percentage of the fair market value that is determined by local assessors to be the total taxable value of land and additions on the property. | Land | Improvement |
|---|---|---|---|---|
| 2025 | $2,167 | $194,150 | $70,275 | $123,875 |
| 2024 | $2,102 | $189,750 | $67,174 | $122,576 |
| 2023 | $1,944 | $322,000 | $107,340 | $214,660 |
| 2022 | $2,074 | $185,900 | $61,116 | $124,784 |
| 2021 | $1,832 | $248,000 | $65,605 | $182,395 |
| 2020 | $1,272 | $171,000 | $55,290 | $115,710 |
| 2019 | $1,251 | $166,000 | $57,514 | $108,486 |
| 2018 | $1,114 | $144,000 | $50,742 | $93,258 |
| 2016 | $1,118 | $75,570 | $20,434 | $55,136 |
| 2015 | $1,078 | $69,465 | $20,434 | $49,031 |
| 2014 | $1,032 | $67,434 | $20,434 | $47,000 |
| 2013 | -- | $63,352 | $25,394 | $37,958 |
Source: Public Records
Map
Nearby Homes
- 853 W 700 N
- 690 Barlow St
- 721 N 800 W
- 1038 W 800 N
- 620 N 1100 W
- 561 N 700 W
- 652 W 800 N Unit 131
- 652 W 800 N Unit 62
- 984 N 1100 W
- 1121 N 900 W
- 1132 N 780 W
- 762 W 300 N
- 417 N 1200 W Unit 84
- 341 W 750 N
- 777 W 300 N
- 288 N 825 W
- Evergreen Plan at Ivie Meadows
- 274 N 825 W
- 423 N 1250 W Unit 118
- 1214 N 700 W