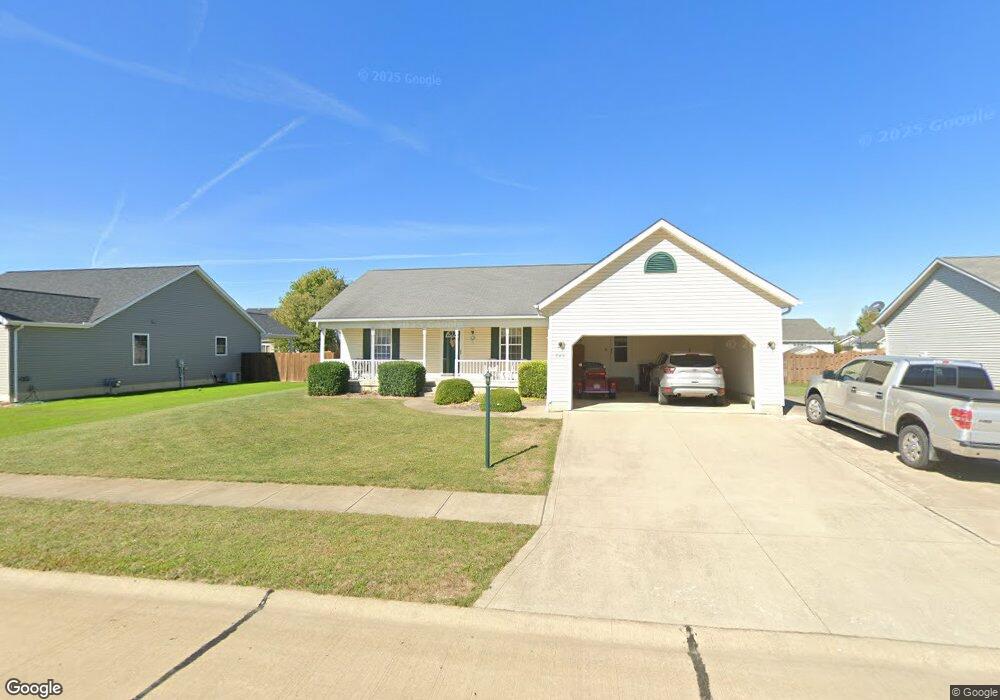
745 Bobcat Dr Lagrange, OH 44050
Estimated Value: $210,000 - $267,000
3
Beds
2
Baths
1,560
Sq Ft
$156/Sq Ft
Est. Value
About This Home
This home is located at 745 Bobcat Dr, Lagrange, OH 44050 and is currently estimated at $243,789, approximately $156 per square foot. 745 Bobcat Dr is a home located in Lorain County with nearby schools including Keystone Elementary School, Keystone Middle School, and Keystone High School.
Ownership History
Date
Name
Owned For
Owner Type
Purchase Details
Closed on
Aug 26, 2008
Sold by
Coughlin Barbara J
Bought by
Teska Philip E
Current Estimated Value
Purchase Details
Closed on
Mar 5, 2007
Sold by
Teska Philip E and Coughlin Barbara J
Bought by
Teska Philip E and Coughlin Barbara J
Purchase Details
Closed on
Dec 13, 2006
Sold by
Knight Leroy and Knight Marjorie G
Bought by
Teska Philip E
Purchase Details
Closed on
Feb 2, 2006
Sold by
David Development Inc
Bought by
Knight Leroy
Home Financials for this Owner
Home Financials are based on the most recent Mortgage that was taken out on this home.
Original Mortgage
$42,525
Interest Rate
6.37%
Mortgage Type
Purchase Money Mortgage
Create a Home Valuation Report for This Property
The Home Valuation Report is an in-depth analysis detailing your home's value as well as a comparison with similar homes in the area
Home Values in the Area
Average Home Value in this Area
Purchase History
| Date | Buyer | Sale Price | Title Company |
|---|---|---|---|
| Teska Philip E | -- | Attorney | |
| Teska Philip E | -- | Elyria Land Title | |
| Teska Philip E | $111,500 | Multiple | |
| Knight Leroy | $53,000 | Lorain County Title Co Inc |
Source: Public Records
Mortgage History
| Date | Status | Borrower | Loan Amount |
|---|---|---|---|
| Previous Owner | Knight Leroy | $42,525 |
Source: Public Records
Tax History
| Year | Tax Paid | Tax Assessment Tax Assessment Total Assessment is a certain percentage of the fair market value that is determined by local assessors to be the total taxable value of land and additions on the property. | Land | Improvement |
|---|---|---|---|---|
| 2024 | $3,592 | $78,484 | $12,425 | $66,059 |
| 2023 | $3,240 | $58,580 | $12,012 | $46,568 |
| 2022 | $3,219 | $58,580 | $12,012 | $46,568 |
| 2021 | $3,219 | $58,580 | $12,010 | $46,570 |
| 2020 | $3,160 | $51,210 | $10,500 | $40,710 |
| 2019 | $3,142 | $51,210 | $10,500 | $40,710 |
| 2018 | $2,773 | $51,210 | $10,500 | $40,710 |
| 2017 | $2,745 | $47,500 | $7,810 | $39,690 |
| 2016 | $2,727 | $47,500 | $7,810 | $39,690 |
| 2015 | $2,722 | $47,500 | $7,810 | $39,690 |
| 2014 | $2,138 | $42,600 | $7,000 | $35,600 |
| 2013 | $2,073 | $42,600 | $7,000 | $35,600 |
Source: Public Records
Map
Nearby Homes
- 704 Black Bear Run
- 42113 Meadow Ln
- 476 Stallion Ct
- 468 Stallion Ct
- 510 Arabian Ct
- 0 West Rd Unit 5125531
- 43311 Peck Wadsworth Rd
- 20630 State Route 301
- 43902 State Route 303
- 110 Railroad St
- 305 W Main St
- 40260 Whitney Rd
- 16974 Hawley Rd
- 317 Church St
- 0 Dill Ct Unit 5072837
- 516 Appomattox Ct
- 567 Vicksburg Ct
- 548 William St
- 0 Ohio 301
- 19720 Ohio 58 Unit 24
- 746 Bobcat Dr
- 744 Bobcat Dr
- 750 Timber Wolf Ln
- 0 Bobcat Dr Unit 4011839
- 0 Bobcat Dr Unit 4011838
- 0 Bobcat Dr Unit 4011753
- 0 Bobcat Dr Unit 4011750
- 0 Bobcat Dr Unit 4011837
- 749 Timber Wolf Ln
- 751 Timber Wolf Ln
- 734 Bobcat Dr
- 735 Bobcat Dr
- 752 Timber Wolf Ln
- 748 Timber Wolf Ln
- 742 Bobcat Dr
- 732 Bobcat Dr
- 753 Timber Wolf Ln
- 737 Bobcat Dr
- 741 Bobcat Dr
- 729 Grey Wolfe Dr
Your Personal Tour Guide
Ask me questions while you tour the home.