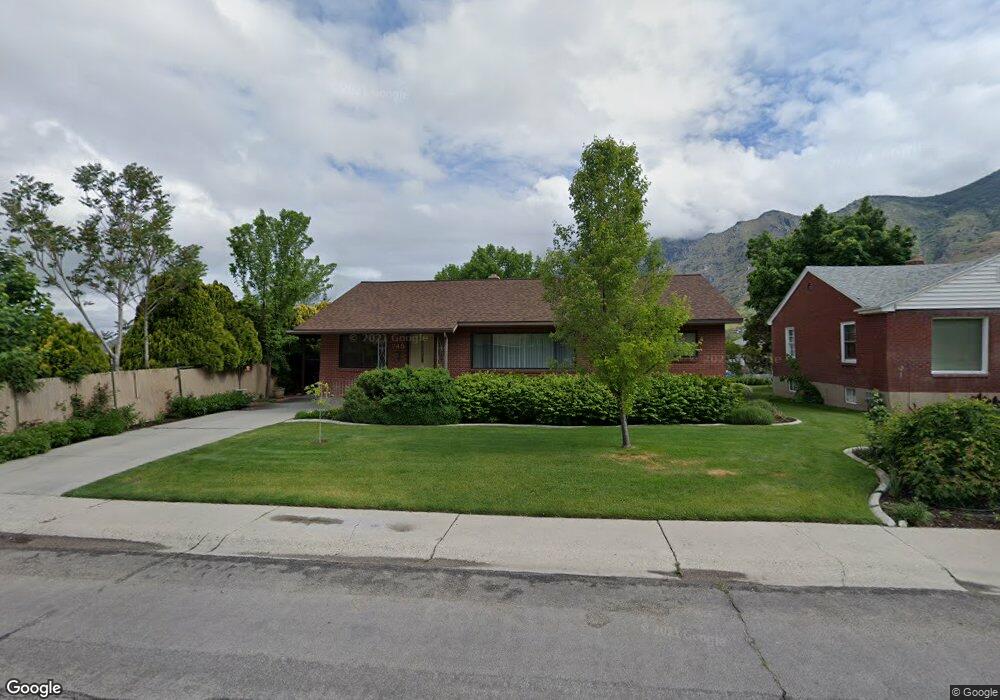
745 Chase Ln Springville, UT 84663
Estimated Value: $455,000 - $511,000
3
Beds
2
Baths
1,380
Sq Ft
$353/Sq Ft
Est. Value
About This Home
This home is located at 745 Chase Ln, Springville, UT 84663 and is currently estimated at $487,795, approximately $353 per square foot. 745 Chase Ln is a home located in Utah County with nearby schools including Brookside School, Springville Junior High School, and Springville High School.
Ownership History
Date
Name
Owned For
Owner Type
Purchase Details
Closed on
Jun 27, 2023
Sold by
Robertson Marilyn Groesbeck
Bought by
Mark And Marilyn Robertson Family Living and Robertson
Current Estimated Value
Home Financials for this Owner
Home Financials are based on the most recent Mortgage that was taken out on this home.
Original Mortgage
$370,800
Outstanding Balance
$360,812
Interest Rate
6.35%
Mortgage Type
Construction
Estimated Equity
$126,983
Purchase Details
Closed on
Jun 22, 2023
Sold by
Mark And Marilyn Robertson Family Living
Bought by
Weakley Spencer and Weakley Mingci Zhou
Home Financials for this Owner
Home Financials are based on the most recent Mortgage that was taken out on this home.
Original Mortgage
$370,800
Outstanding Balance
$360,812
Interest Rate
6.35%
Mortgage Type
Construction
Estimated Equity
$126,983
Purchase Details
Closed on
Oct 6, 1998
Sold by
Robertson Mark S and Robertson Marilyn G
Bought by
Robertson Mark S and Robertson Marilyn G
Create a Home Valuation Report for This Property
The Home Valuation Report is an in-depth analysis detailing your home's value as well as a comparison with similar homes in the area
Home Values in the Area
Average Home Value in this Area
Purchase History
| Date | Buyer | Sale Price | Title Company |
|---|---|---|---|
| Mark And Marilyn Robertson Family Living | -- | -- | |
| Mark And Marilyn Robertson Family Living | -- | -- | |
| Weakley Spencer | $493,164 | Union Title | |
| Robertson Mark S | -- | -- |
Source: Public Records
Mortgage History
| Date | Status | Borrower | Loan Amount |
|---|---|---|---|
| Open | Weakley Spencer | $370,800 |
Source: Public Records
Tax History Compared to Growth
Tax History
| Year | Tax Paid | Tax Assessment Tax Assessment Total Assessment is a certain percentage of the fair market value that is determined by local assessors to be the total taxable value of land and additions on the property. | Land | Improvement |
|---|---|---|---|---|
| 2025 | $2,264 | $451,500 | $157,900 | $293,600 |
| 2024 | $2,264 | $231,990 | $0 | $0 |
| 2023 | $2,241 | $229,790 | $0 | $0 |
| 2022 | $2,348 | $236,500 | $0 | $0 |
| 2021 | $2,082 | $326,400 | $113,700 | $212,700 |
| 2020 | $1,886 | $286,600 | $84,200 | $202,400 |
| 2019 | $1,762 | $272,600 | $70,200 | $202,400 |
| 2018 | $1,526 | $246,100 | $65,300 | $180,800 |
| 2017 | $1,560 | $122,320 | $0 | $0 |
| 2016 | $1,326 | $113,410 | $0 | $0 |
| 2015 | -- | $105,105 | $0 | $0 |
| 2014 | $1,085 | $96,195 | $0 | $0 |
Source: Public Records
Map
Nearby Homes
- 40 Brookside Dr
- 802 S Brookside Dr
- 649 Swenson Ave Unit 4
- 639 Swenson Ave Unit 4
- 1062 E 350 S
- 509 Brookside Dr
- 445 Swenson Ave
- 115 N 750 E
- 1185 Hillcrest Dr
- 511 S 300 E Unit 2
- 2554 E 350 S Unit 4
- 393 E Center St
- 177 S Canyon Ave
- 337 E 600 S
- 633 E 800 St S
- 615 E 800 St S
- 581 E 800 St S
- 211 N 650 E
- 630 E 800 St S
- 629 E 800 St S