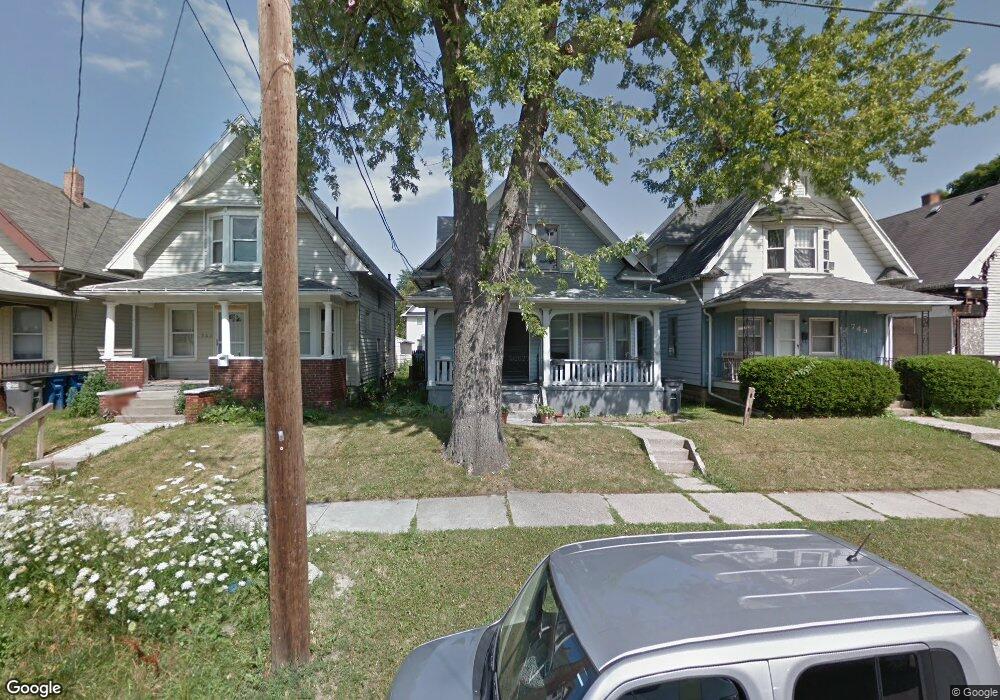
745 Clark St Toledo, OH 43605
East Toledo NeighborhoodEstimated Value: $50,000 - $80,000
5
Beds
2
Baths
1,894
Sq Ft
$36/Sq Ft
Est. Value
About This Home
This home is located at 745 Clark St, Toledo, OH 43605 and is currently estimated at $67,687, approximately $35 per square foot. 745 Clark St is a home located in Lucas County with nearby schools including Navarre Elementary School, Waite High School, and L. Hollingworth School For Talented And Gifted.
Ownership History
Date
Name
Owned For
Owner Type
Purchase Details
Closed on
Sep 19, 2014
Sold by
Rumora Engelo
Bought by
Almarzooq Dawood A D
Current Estimated Value
Purchase Details
Closed on
Sep 3, 2014
Sold by
Verdell Kenneth W and Verdell Michele
Bought by
Ohio Cashflow Llc
Purchase Details
Closed on
Mar 18, 2003
Sold by
Manufacturers & Traders Trust Co
Bought by
Verdell Kenneth W and Verdell Michelle
Home Financials for this Owner
Home Financials are based on the most recent Mortgage that was taken out on this home.
Original Mortgage
$18,000
Interest Rate
5.87%
Mortgage Type
Purchase Money Mortgage
Purchase Details
Closed on
Sep 24, 2002
Sold by
Brant Douglas
Bought by
Manufacturers & Traders Trust Co and Securitization Series 1998-1
Purchase Details
Closed on
Feb 4, 1998
Sold by
Roberts Phillip L
Bought by
Brant Douglas W
Purchase Details
Closed on
Sep 27, 1988
Sold by
Rice Barbara
Create a Home Valuation Report for This Property
The Home Valuation Report is an in-depth analysis detailing your home's value as well as a comparison with similar homes in the area
Home Values in the Area
Average Home Value in this Area
Purchase History
| Date | Buyer | Sale Price | Title Company |
|---|---|---|---|
| Almarzooq Dawood A D | $42,250 | None Available | |
| Ohio Cashflow Llc | $12,500 | None Available | |
| Verdell Kenneth W | $20,500 | Accutitle Agency Inc | |
| Manufacturers & Traders Trust Co | $30,000 | Accutitle Agency Inc | |
| Brant Douglas W | $37,000 | Title Research Inc | |
| -- | $33,000 | -- |
Source: Public Records
Mortgage History
| Date | Status | Borrower | Loan Amount |
|---|---|---|---|
| Previous Owner | Verdell Kenneth W | $18,000 |
Source: Public Records
Tax History Compared to Growth
Tax History
| Year | Tax Paid | Tax Assessment Tax Assessment Total Assessment is a certain percentage of the fair market value that is determined by local assessors to be the total taxable value of land and additions on the property. | Land | Improvement |
|---|---|---|---|---|
| 2024 | $13,521 | $11,830 | $3,535 | $8,295 |
| 2023 | $1,284 | $12,040 | $3,325 | $8,715 |
| 2022 | $975 | $12,040 | $3,325 | $8,715 |
| 2021 | $884 | $12,040 | $3,325 | $8,715 |
| 2020 | $1,317 | $11,725 | $3,185 | $8,540 |
| 2019 | $942 | $11,725 | $3,185 | $8,540 |
| 2018 | $467 | $11,725 | $3,185 | $8,540 |
| 2017 | $2,077 | $11,445 | $3,115 | $8,330 |
| 2016 | $957 | $32,700 | $8,900 | $23,800 |
| 2015 | $944 | $32,700 | $8,900 | $23,800 |
| 2014 | $720 | $11,450 | $3,120 | $8,330 |
| 2013 | $720 | $11,450 | $3,120 | $8,330 |
Source: Public Records
Map
Nearby Homes