Estimated Value: $726,000 - $882,000
4
Beds
3
Baths
2,430
Sq Ft
$332/Sq Ft
Est. Value
About This Home
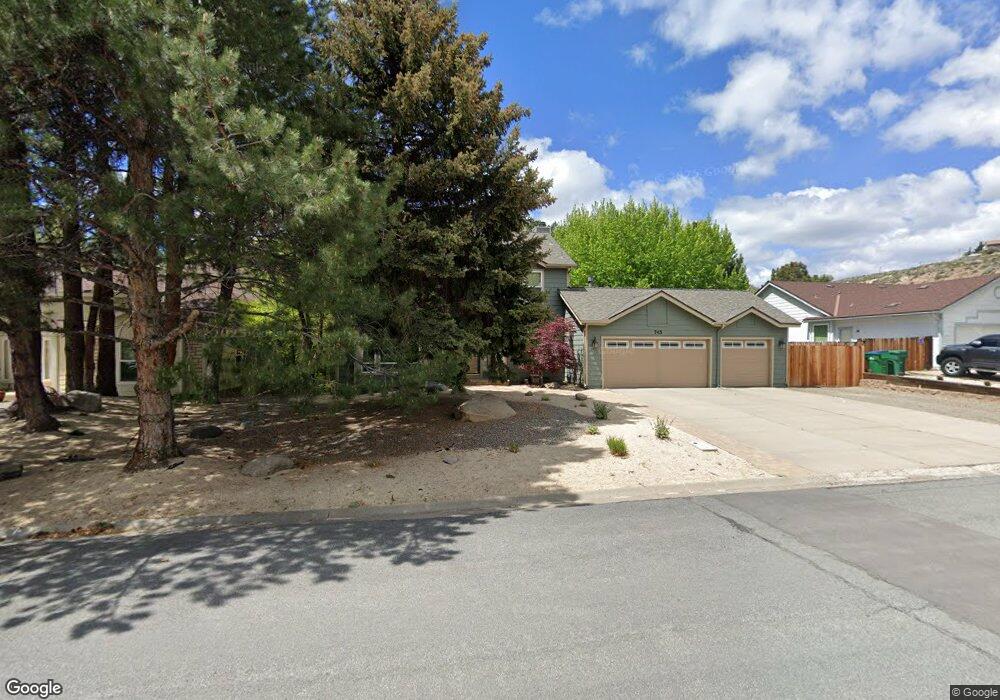
This home is located at 745 Cliff View Dr, Reno, NV 89523 and is currently estimated at $806,252, approximately $331 per square foot. 745 Cliff View Dr is a home located in Washoe County with nearby schools including Verdi Elementary School, B D Billinghurst Middle School, and Robert McQueen High School.
Ownership History
Date
Name
Owned For
Owner Type
Purchase Details
Closed on
May 19, 2014
Sold by
Okada Norman T and Okada Linda O
Bought by
The Nls Family Trust
Current Estimated Value
Purchase Details
Closed on
Sep 7, 2005
Sold by
Sutherland John and Sutherland Elsie
Bought by
Okada Norman T and Okada Linda O
Home Financials for this Owner
Home Financials are based on the most recent Mortgage that was taken out on this home.
Original Mortgage
$350,000
Outstanding Balance
$188,447
Interest Rate
6.25%
Mortgage Type
Unknown
Estimated Equity
$617,805
Purchase Details
Closed on
Apr 22, 1999
Sold by
Healy David Y and Healy Phyllis A
Bought by
Sutherland John and Sutherland Elsie
Home Financials for this Owner
Home Financials are based on the most recent Mortgage that was taken out on this home.
Original Mortgage
$172,000
Interest Rate
9.87%
Purchase Details
Closed on
Aug 25, 1998
Sold by
Healy David Y and Healy Phyllis A
Bought by
Healy David Y and Healy Phyllis A
Create a Home Valuation Report for This Property
The Home Valuation Report is an in-depth analysis detailing your home's value as well as a comparison with similar homes in the area
Home Values in the Area
Average Home Value in this Area
Purchase History
| Date | Buyer | Sale Price | Title Company |
|---|---|---|---|
| The Nls Family Trust | -- | None Available | |
| Okada Norman T | $540,000 | Stewart Title Of Northern Nv | |
| Sutherland John | $215,000 | Western Title Company Inc | |
| Healy David Y | -- | -- |
Source: Public Records
Mortgage History
| Date | Status | Borrower | Loan Amount |
|---|---|---|---|
| Open | Okada Norman T | $350,000 | |
| Previous Owner | Sutherland John | $172,000 | |
| Closed | Sutherland John | $21,500 |
Source: Public Records
Tax History
| Year | Tax Paid | Tax Assessment Tax Assessment Total Assessment is a certain percentage of the fair market value that is determined by local assessors to be the total taxable value of land and additions on the property. | Land | Improvement |
|---|---|---|---|---|
| 2026 | $2,557 | $141,035 | $56,840 | $84,195 |
| 2025 | $3,324 | $143,204 | $56,840 | $86,364 |
| 2024 | $3,324 | $142,191 | $54,250 | $87,941 |
| 2023 | $3,228 | $136,000 | $52,675 | $83,325 |
| 2022 | $3,137 | $111,917 | $43,085 | $68,832 |
| 2021 | $3,044 | $101,626 | $32,270 | $69,356 |
| 2020 | $2,956 | $101,439 | $31,500 | $69,939 |
| 2019 | $2,869 | $97,266 | $29,050 | $68,216 |
| 2018 | $2,782 | $90,503 | $23,450 | $67,053 |
| 2017 | $2,704 | $84,917 | $17,430 | $67,487 |
| 2016 | $2,624 | $84,009 | $16,905 | $67,104 |
| 2015 | $2,618 | $82,374 | $15,190 | $67,184 |
| 2014 | $2,543 | $80,381 | $15,540 | $64,841 |
| 2013 | -- | $75,711 | $11,585 | $64,126 |
Source: Public Records
Map
Nearby Homes
- 65 Nightowl Dr
- 40 Eagle Claw Ct
- 0 Cliff View Dr
- 280 Eucalyptus Ct
- 415 Gooseberry Dr
- 80 Bobcat Dr
- 0 Mountain Haven Ln
- 1660 Boulder Ridge Ct
- 8726 Larkhaven Ct
- 1150 Cliff Park Way
- 1068 Callaway Trail
- 865 Larrimore Trail
- 845 Larrimore Trail
- 9225 Sassafras Trail
- 8778 Larkhaven Trail
- 1539 Elk Run Trail
- 1240 Cliff Park Way
- 8775 Twelve Moons Ct
- 1140 Sugar Creek Trail
- 1165 Sugar Creek Trail
- 755 Cliff View Dr
- 735 Cliff View Dr
- 765 Cliff View Dr
- 750 Cliff View Dr
- 760 Cliff View Dr
- 10400 Nighthawk Cir
- 775 Cliff View Dr
- 10385 Mountain Dew Cir
- 10390 Nighthawk Cir
- 800 Cliff View Dr
- 785 Cliff View Dr
- 485 Mogul Mountain Dr
- 10375 Mountain Dew Cir
- 180 Moonshine Cir
- 10415 Nighthawk Cir
- 810 Cliff View Dr
- 815 Cliff View Dr
- 200 Moonshine Cir
- 10395 Nighthawk Cir
- 465 Mogul Mountain Dr
Your Personal Tour Guide
Ask me questions while you tour the home.