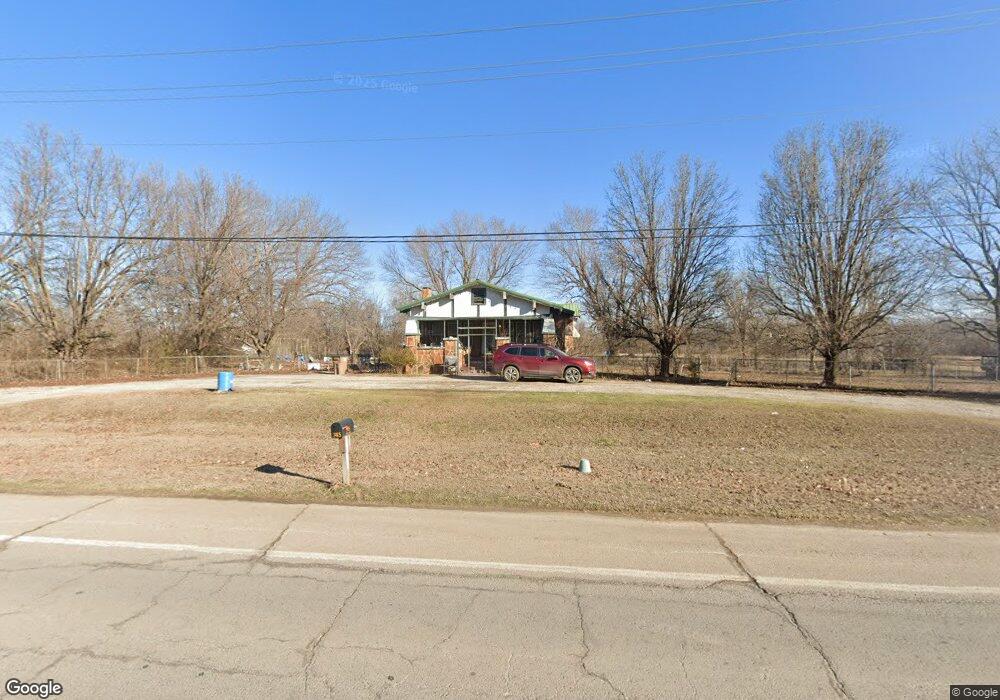
745 E 98th St N Sperry, OK 74073
Estimated Value: $121,000 - $215,000
Studio
1
Bath
1,649
Sq Ft
$96/Sq Ft
Est. Value
About This Home
This home is located at 745 E 98th St N, Sperry, OK 74073 and is currently estimated at $157,789, approximately $95 per square foot. 745 E 98th St N is a home located in Tulsa County with nearby schools including Sperry Elementary School, Sperry Middle School, and Sperry High School.
Ownership History
Date
Name
Owned For
Owner Type
Purchase Details
Closed on
Jul 7, 2021
Sold by
Curtis R Wilson Living Revocable Trust and Wilson Patsy Darlene
Bought by
Morrow Derrell K
Current Estimated Value
Purchase Details
Closed on
May 7, 2010
Sold by
Wilson Curtis R
Bought by
Morrow Derrell K
Home Financials for this Owner
Home Financials are based on the most recent Mortgage that was taken out on this home.
Original Mortgage
$60,000
Interest Rate
4.93%
Mortgage Type
Seller Take Back
Purchase Details
Closed on
Apr 20, 2010
Sold by
Willhite Darrin and Whillhite Dona
Bought by
Wilson Curtis R and The Curtis R Wilson Living Revocable Tru
Home Financials for this Owner
Home Financials are based on the most recent Mortgage that was taken out on this home.
Original Mortgage
$60,000
Interest Rate
4.93%
Mortgage Type
Seller Take Back
Purchase Details
Closed on
Oct 26, 2004
Sold by
Wilson Curtis R
Bought by
Willhite Darrin and Willhite Dona
Create a Home Valuation Report for This Property
The Home Valuation Report is an in-depth analysis detailing your home's value as well as a comparison with similar homes in the area
Purchase History
| Date | Buyer | Sale Price | Title Company |
|---|---|---|---|
| Morrow Derrell K | $60,000 | None Listed On Document | |
| Morrow Derrell K | $60,000 | None Available | |
| Wilson Curtis R | -- | None Available | |
| Willhite Darrin | $70,000 | -- |
Source: Public Records
Mortgage History
| Date | Status | Borrower | Loan Amount |
|---|---|---|---|
| Previous Owner | Morrow Derrell K | $60,000 | |
| Closed | Willhite Darrin | $0 |
Source: Public Records
Tax History
| Year | Tax Paid | Tax Assessment Tax Assessment Total Assessment is a certain percentage of the fair market value that is determined by local assessors to be the total taxable value of land and additions on the property. | Land | Improvement |
|---|---|---|---|---|
| 2025 | $736 | $6,600 | $869 | $5,731 |
| 2024 | $734 | $6,600 | $869 | $5,731 |
| 2023 | $734 | $6,600 | $869 | $5,731 |
| 2022 | $739 | $6,600 | $869 | $5,731 |
| 2021 | $624 | $5,600 | $737 | $4,863 |
| 2020 | $625 | $5,600 | $737 | $4,863 |
| 2019 | $629 | $5,600 | $737 | $4,863 |
| 2018 | $629 | $5,600 | $737 | $4,863 |
| 2017 | $609 | $6,600 | $869 | $5,731 |
| 2016 | $607 | $6,600 | $869 | $5,731 |
| 2015 | $603 | $6,600 | $869 | $5,731 |
| 2014 | $596 | $6,600 | $869 | $5,731 |
Source: Public Records
Map
Nearby Homes
- 207 N Elgin Ave
- 9610 N Peoria Ave
- 9839 N Peoria Ave
- 10201 N Cincinnati Ave
- 35 W Main St
- 9545 N Cincinnati Ave
- 26 W Ash St
- 202 W Ada St
- 107 W Carter St
- 110 W Carter St
- 4787 E 106th St N
- 313 W Birch Place
- 0 Sunset Unit 2544339
- 0 Sunset Unit 2544356
- 215 S 4th St
- 405 S 4th St
- 9507 N Osage Dr
- 0 N Wheeling Rd
- 2012 W 88th St N
- 8588 N Cincinnati Ave
- 801 E 98th St N
- 760 E 98th St N
- 741 E 98th St N
- 740 E 98th St N
- 0 Oklahoma 11
- 948 E 98th St N
- 913 E 98th St N
- 950 E 98th St N
- 201 N Garrison Ave
- 203 N Garrison Ave
- 205 N Garrison Ave
- 207 N Garrison Ave
- 509 E Ada St
- 209 N Garrison Ave
- 105 N Frankfort Ave
- 107 N Frankfort Ave
- 211 N Garrison Ave
- 507 E Ada St
- 113 N Frankfort Ave
- 115 N Frankfort Ave
Your Personal Tour Guide
Ask me questions while you tour the home.