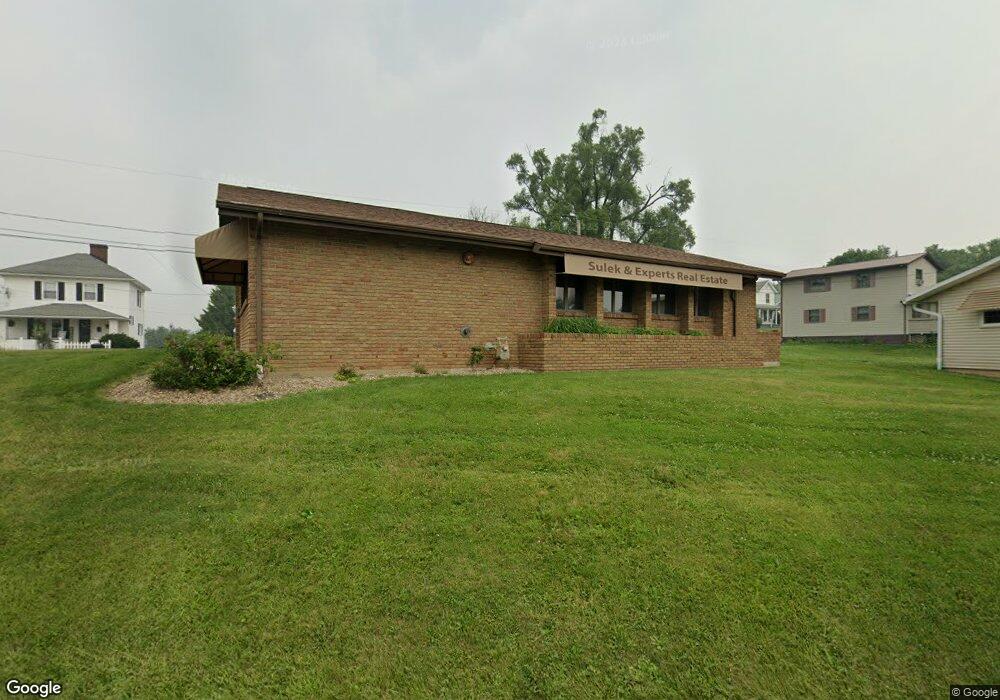
745 E Main St Barnesville, OH 43713
Estimated Value: $497,396
Studio
1
Bath
1,310
Sq Ft
$380/Sq Ft
Est. Value
About This Home
This home is located at 745 E Main St, Barnesville, OH 43713 and is currently estimated at $497,396, approximately $379 per square foot. 745 E Main St is a home located in Belmont County with nearby schools including Barnesville Elementary School, Barnesville Middle School, and Barnesville High School.
Ownership History
Date
Name
Owned For
Owner Type
Purchase Details
Closed on
Feb 15, 2017
Sold by
Nosakelus Llc
Bought by
Glew Llc
Current Estimated Value
Purchase Details
Closed on
Jan 8, 2014
Sold by
Wilson Fred J and Wilson Kathleen G
Bought by
Nosakelus Llc
Home Financials for this Owner
Home Financials are based on the most recent Mortgage that was taken out on this home.
Original Mortgage
$179,920
Interest Rate
4.31%
Mortgage Type
Commercial
Purchase Details
Closed on
Jan 1, 1987
Sold by
Wilson Fred J and Wilson Kathleen
Bought by
Wilson Fred J and Wilson Kathleen G
Create a Home Valuation Report for This Property
The Home Valuation Report is an in-depth analysis detailing your home's value as well as a comparison with similar homes in the area
Home Values in the Area
Average Home Value in this Area
Purchase History
| Date | Buyer | Sale Price | Title Company |
|---|---|---|---|
| Glew Llc | -- | Northwest Title | |
| Nosakelus Llc | $224,900 | Attorney | |
| Wilson Fred J | -- | -- |
Source: Public Records
Mortgage History
| Date | Status | Borrower | Loan Amount |
|---|---|---|---|
| Previous Owner | Nosakelus Llc | $179,920 |
Source: Public Records
Tax History
| Year | Tax Paid | Tax Assessment Tax Assessment Total Assessment is a certain percentage of the fair market value that is determined by local assessors to be the total taxable value of land and additions on the property. | Land | Improvement |
|---|---|---|---|---|
| 2025 | $2,319 | $51,480 | $31,990 | $19,490 |
| 2023 | $1,890 | $41,820 | $17,110 | $24,710 |
| 2022 | $1,983 | $41,818 | $17,108 | $24,710 |
| 2021 | $2,057 | $41,814 | $17,104 | $24,710 |
| 2020 | $2,098 | $41,810 | $17,100 | $24,710 |
| 2019 | $2,094 | $41,810 | $17,100 | $24,710 |
| 2018 | $2,103 | $41,810 | $17,100 | $24,710 |
| 2017 | $2,219 | $43,750 | $16,640 | $27,110 |
| 2016 | $2,007 | $43,750 | $16,640 | $27,110 |
| 2015 | $2,007 | $43,750 | $16,640 | $27,110 |
| 2014 | $2,034 | $40,890 | $15,550 | $25,340 |
| 2013 | $1,934 | $40,890 | $15,550 | $25,340 |
Source: Public Records
Map
Nearby Homes
- 724 E Main St
- 126 Oak St
- 118 Pine Ln
- 613 E Main St
- 501 E Main St
- 164 Pine Ln
- 0 Fairmont Ave Unit 5163774
- 0 Fairmont Ave Unit 5163784
- 0 Tract 17 Brown Peavine Rd Rd
- 438 N Lincoln Ave
- 152 E Main St
- 202 Walton Ave
- 617 Park St
- 618 Park St
- 62239 Hillcrest Rd
- TBD W Main St
- 0 County Road 114
- Lot 1 Cattle Dr
- 57128 Somerton Hwy
- 0 Nevada Rd
Your Personal Tour Guide
Ask me questions while you tour the home.