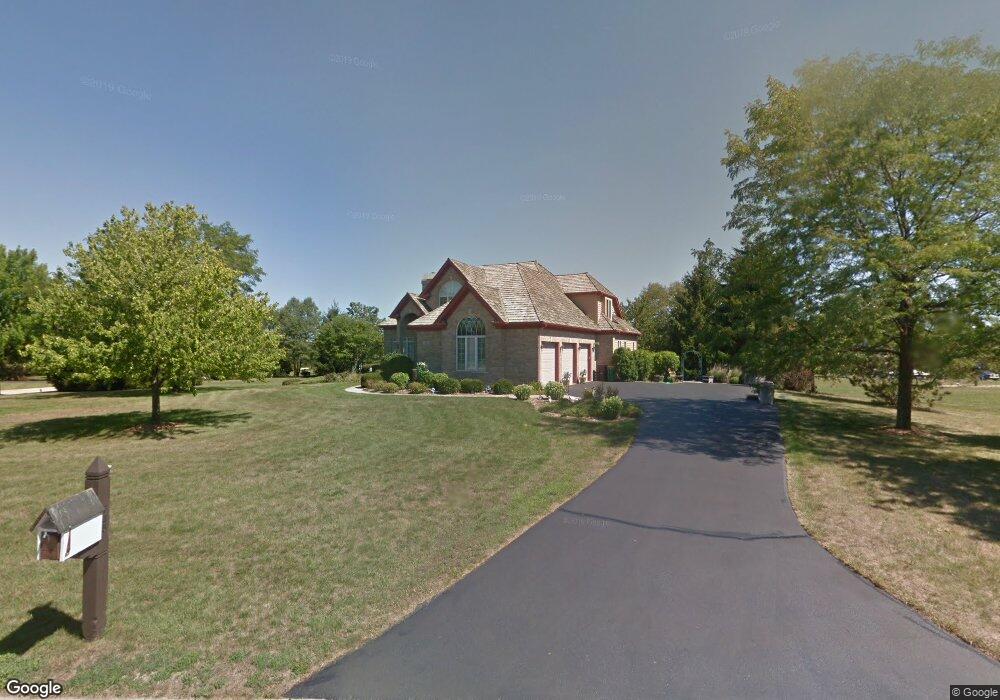
745 Hanley Dr Antioch, IL 60002
Estimated Value: $572,000 - $701,000
4
Beds
5
Baths
3,248
Sq Ft
$198/Sq Ft
Est. Value
About This Home
This home is located at 745 Hanley Dr, Antioch, IL 60002 and is currently estimated at $642,877, approximately $197 per square foot. 745 Hanley Dr is a home located in Lake County with nearby schools including Antioch Community High School.
Ownership History
Date
Name
Owned For
Owner Type
Purchase Details
Closed on
May 16, 2024
Sold by
Albert A Bucar Sr Declaration Of Trust and Linda C Bucar Declaration Of Trust
Bought by
Linda C Bucar Declaration Of Trust and Bucar
Current Estimated Value
Purchase Details
Closed on
Dec 1, 2022
Sold by
Albert A And Linda C Bucar Living Trust
Bought by
Albert A Bucar Sr Declaration Of Trust and Linda C Bucar Declaration Of Trust
Purchase Details
Closed on
Jun 4, 2007
Sold by
Vosper Godfrey W and Vosper Rita M
Bought by
Bucar Albert A and Bucar Linda C
Purchase Details
Closed on
Sep 28, 2005
Sold by
Vosper Godfry W
Bought by
Vosper Godfrey W and Vosper Rita M
Purchase Details
Closed on
May 7, 1998
Sold by
Vosper Godfrey W and Vosper Rita M
Bought by
Vosper Godrey W and Vosper Rita M
Purchase Details
Closed on
Apr 29, 1997
Sold by
Spring Bluff Industries Inc
Bought by
Vosper Godfrey W and Vosper Rita M
Purchase Details
Closed on
Mar 24, 1995
Sold by
Gozun Alfredo
Bought by
Gozun Leticia
Create a Home Valuation Report for This Property
The Home Valuation Report is an in-depth analysis detailing your home's value as well as a comparison with similar homes in the area
Home Values in the Area
Average Home Value in this Area
Purchase History
| Date | Buyer | Sale Price | Title Company |
|---|---|---|---|
| Linda C Bucar Declaration Of Trust | -- | None Listed On Document | |
| Albert A Bucar Sr Declaration Of Trust | -- | -- | |
| Bucar Albert A | $560,000 | None Available | |
| Vosper Godfrey W | -- | -- | |
| Vosper Godrey W | -- | -- | |
| Vosper Godfrey W | $393,000 | Chicago Title Insurance Co | |
| Gozun Leticia | -- | -- |
Source: Public Records
Tax History Compared to Growth
Tax History
| Year | Tax Paid | Tax Assessment Tax Assessment Total Assessment is a certain percentage of the fair market value that is determined by local assessors to be the total taxable value of land and additions on the property. | Land | Improvement |
|---|---|---|---|---|
| 2024 | $16,426 | $184,531 | $16,000 | $168,531 |
| 2023 | $18,185 | $165,232 | $14,327 | $150,905 |
| 2022 | $18,185 | $172,907 | $17,057 | $155,850 |
| 2021 | $16,862 | $161,339 | $15,916 | $145,423 |
| 2020 | $16,518 | $156,883 | $15,476 | $141,407 |
| 2019 | $16,752 | $150,027 | $14,800 | $135,227 |
| 2018 | $15,934 | $145,792 | $21,619 | $124,173 |
| 2017 | $15,785 | $138,770 | $20,578 | $118,192 |
| 2016 | $15,391 | $133,922 | $19,859 | $114,063 |
| 2015 | $15,031 | $130,516 | $19,354 | $111,162 |
| 2014 | $16,557 | $147,241 | $31,041 | $116,200 |
| 2012 | $14,731 | $147,241 | $31,041 | $116,200 |
Source: Public Records
Map
Nearby Homes
- 41092 N Deep Lake Rd
- 909 Forest View Way
- 1286 Goldfinch Ln
- 1082 Holly Dr
- 1101 N Deep Lake Rd
- 631 Hidden Creek Dr
- 22031 W Spruce Dr
- 40963 N Champaign Dr
- 1063 Joy Ct
- 1056 Deertrail Ct
- 39930 Savage Rd
- 40472 N Donald Dr
- 41147 N Lincoln Ave
- 1214 Jerome Ct
- 20475 W Il Route 173
- 22220 W Loon Dr
- 1055 Christine Ln
- 336 Oakhill Ct
- 1062 Neuhaven Dr
- 22271 W Loon Dr
- 761 Hanley Dr
- 1421 Eagle Ridge Dr
- 744 Hanley Dr
- 1440 Eagle Ridge Dr
- 773 Hanley Dr
- 1422 Eagle Ridge Dr
- 760 Hanley Dr
- 1403 Eagle Ridge Dr
- 785 Hanley Dr
- 1381 Eagle Ridge Dr
- 791 Hanley Dr
- 1400 Eagle Ridge Dr
- 774 Hanley Dr
- 1391 Eagle Ridge Dr
- 1484 Eagle Ridge Dr
- 1489 Eagle Ridge Dr
- 778 Hanley Dr
- 1496 Eagle Ridge Dr
- 1491 Eagle Ridge Dr
- 1488 Eagle Ridge Dr