745 Imperial Dr Martin, GA 30557
Estimated Value: $710,000 - $1,136,000
3
Beds
4
Baths
2,811
Sq Ft
$329/Sq Ft
Est. Value
About This Home
This home is located at 745 Imperial Dr, Martin, GA 30557 and is currently estimated at $925,121, approximately $329 per square foot. 745 Imperial Dr is a home with nearby schools including Stephens County High School.
Ownership History
Date
Name
Owned For
Owner Type
Purchase Details
Closed on
Feb 23, 2017
Sold by
Thomason Kennerly Byron
Bought by
Kennerly Christian P and Kennerly Christine Carroll
Current Estimated Value
Purchase Details
Closed on
Jul 3, 1992
Sold by
Kennerly Byron
Bought by
Kennerly Byron Thomason
Purchase Details
Closed on
Jun 26, 1992
Sold by
Houston C Kenneth
Bought by
Kennerly Byron
Purchase Details
Closed on
Dec 20, 1988
Sold by
Houston Margaret G
Bought by
Houston C Kenneth
Purchase Details
Closed on
Sep 7, 1983
Sold by
Houston Charlie I Estate
Bought by
Houston Margaret Genette
Purchase Details
Closed on
Sep 12, 1963
Sold by
Camden Camden H and Camden Thomason J
Bought by
Houston Charlie I
Purchase Details
Closed on
Nov 23, 1962
Sold by
Mashburn Crowder N and Mashburn M
Bought by
Camden Hi & Cl Houston & Jm Thomason
Create a Home Valuation Report for This Property
The Home Valuation Report is an in-depth analysis detailing your home's value as well as a comparison with similar homes in the area
Home Values in the Area
Average Home Value in this Area
Purchase History
| Date | Buyer | Sale Price | Title Company |
|---|---|---|---|
| Kennerly Christian P | $140,000 | -- | |
| Kennerly Byron Thomason | $115,000 | -- | |
| Kennerly Byron | -- | -- | |
| Houston C Kenneth | -- | -- | |
| Houston Margaret Genette | -- | -- | |
| Houston Charlie I | -- | -- | |
| Camden Hi & Cl Houston & Jm Thomason | -- | -- |
Source: Public Records
Tax History Compared to Growth
Tax History
| Year | Tax Paid | Tax Assessment Tax Assessment Total Assessment is a certain percentage of the fair market value that is determined by local assessors to be the total taxable value of land and additions on the property. | Land | Improvement |
|---|---|---|---|---|
| 2025 | $9,331 | $339,937 | $110,110 | $229,827 |
| 2024 | $7,898 | $259,362 | $110,110 | $149,252 |
| 2023 | $7,413 | $248,997 | $110,110 | $138,887 |
| 2022 | $7,168 | $240,794 | $110,110 | $130,684 |
| 2021 | $7,231 | $231,230 | $110,110 | $121,120 |
| 2020 | $7,183 | $227,463 | $110,110 | $117,353 |
| 2019 | $7,213 | $227,463 | $110,110 | $117,353 |
| 2018 | $1,776 | $120,770 | $110,110 | $10,660 |
| 2017 | $3,890 | $120,770 | $110,110 | $10,660 |
| 2016 | $3,830 | $120,769 | $110,110 | $10,659 |
| 2015 | $4,482 | $134,958 | $110,110 | $24,848 |
| 2014 | $4,646 | $137,610 | $110,110 | $27,500 |
| 2013 | -- | $137,600 | $111,200 | $26,400 |
Source: Public Records
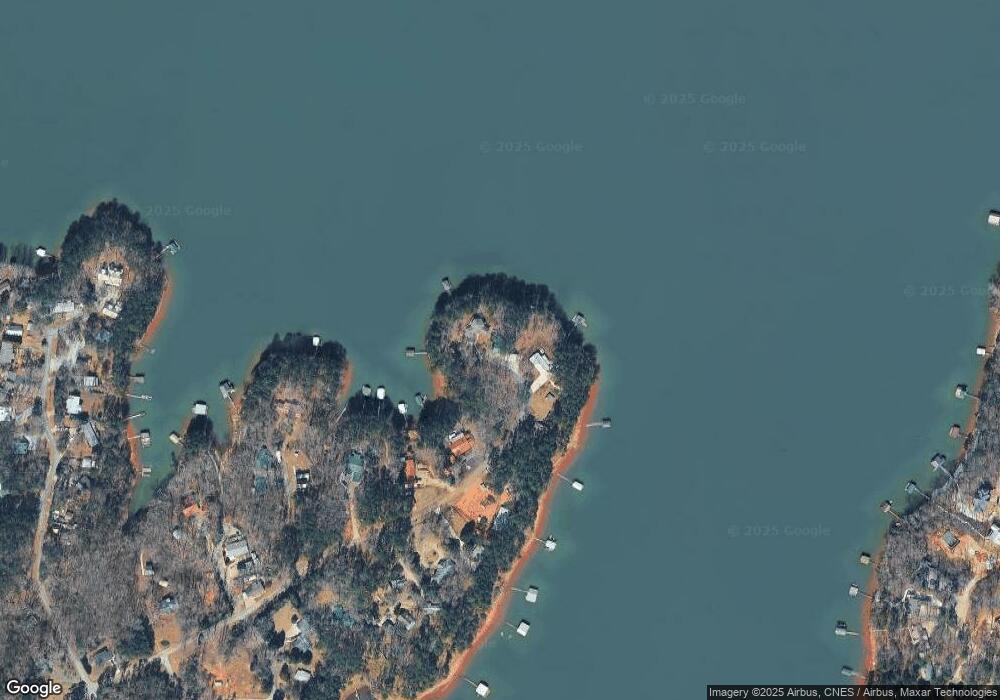
Map
Nearby Homes
- 188 Imperial Dr
- Lot 57 Foxboro Rd
- 603 Foxboro Rd
- 418 Kenwood Dr
- 243 Continental Dr
- 81 Continental Dr
- 417 Century Dr
- 102 Middleton Dr
- 102 Century Dr
- 22 Century Dr
- 73 Century Dr
- Lot 1&2 Bertha Allen Rd
- 157 Deerwood Dr
- 0 Bruce Rd Unit 10573921
- 0 Bruce Rd Unit 24288592
- 311 Pecan Dr
- 605 Elizabeth (Lot 1) Rd
- 235 Walnut Dr
- 605 Elizabeth (Lot 2) Rd
- 605 Elizabeth Rd
- 726 Imperial Dr
- 714 Imperial Dr
- 704 Imperial Dr
- 657 Imperial Dr
- 678 Imperial Dr
- 619 Imperial Dr
- 664 Imperial Dr
- 76 Capri Ln
- 64 Capri Ln
- 624 Imperial Dr
- 571 Imperial Dr
- 604 Imperial Dr
- 67 Capri Ln
- 43 Capri Ln
- 572 Imperial Dr
- 538 Imperial Dr
- 178 Riviera Dr
- 495 Imperial Dr
- 184 Riviera Dr
- 108 Riviera Dr