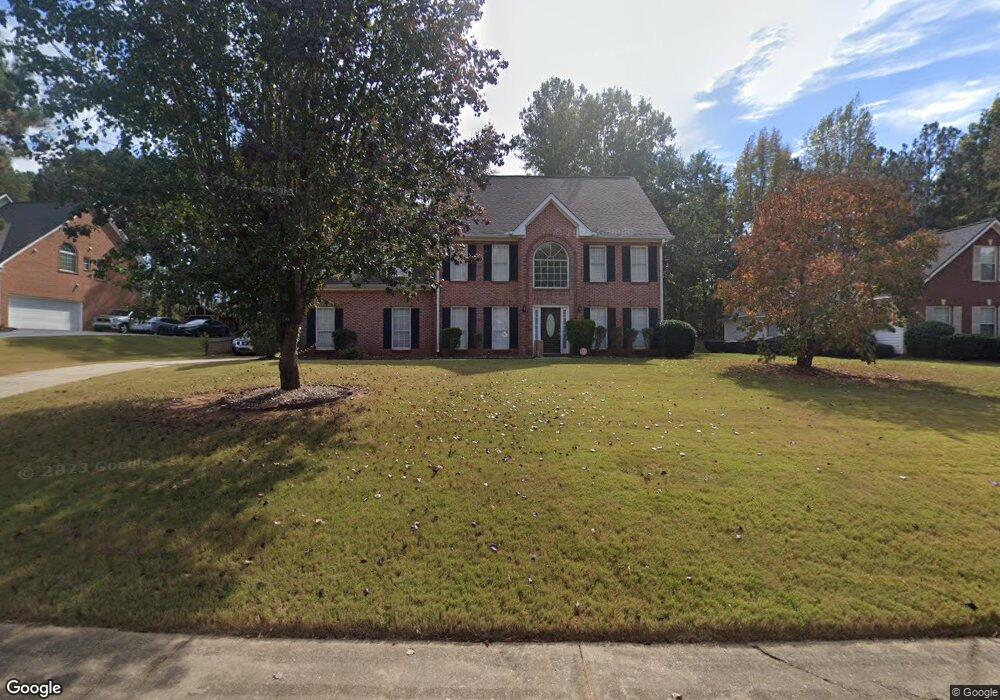
745 Lynn Milam Ln Conyers, GA 30094
Estimated Value: $375,000 - $412,000
4
Beds
3
Baths
2,724
Sq Ft
$142/Sq Ft
Est. Value
About This Home
This home is located at 745 Lynn Milam Ln, Conyers, GA 30094 and is currently estimated at $388,158, approximately $142 per square foot. 745 Lynn Milam Ln is a home located in Rockdale County with nearby schools including Barksdale Elementary School, Gen. Ray Davis Middle School, and Heritage High School.
Ownership History
Date
Name
Owned For
Owner Type
Purchase Details
Closed on
Aug 24, 2020
Sold by
Edwards Ermine R
Bought by
Ennis Mark C and Brissett Ennis Marcia
Current Estimated Value
Home Financials for this Owner
Home Financials are based on the most recent Mortgage that was taken out on this home.
Original Mortgage
$230,375
Outstanding Balance
$204,359
Interest Rate
3%
Mortgage Type
New Conventional
Estimated Equity
$183,799
Purchase Details
Closed on
Nov 4, 2003
Sold by
Duvall Darrell K and Duvall Paula A
Bought by
Wells Fargo Bk
Purchase Details
Closed on
Mar 31, 2000
Sold by
Howard G Pennington Inc
Bought by
Duvall Darrell K and Duvall Paula A
Home Financials for this Owner
Home Financials are based on the most recent Mortgage that was taken out on this home.
Original Mortgage
$140,000
Interest Rate
8.34%
Mortgage Type
New Conventional
Create a Home Valuation Report for This Property
The Home Valuation Report is an in-depth analysis detailing your home's value as well as a comparison with similar homes in the area
Home Values in the Area
Average Home Value in this Area
Purchase History
| Date | Buyer | Sale Price | Title Company |
|---|---|---|---|
| Ennis Mark C | $242,500 | -- | |
| Wells Fargo Bk | $144,001 | -- | |
| Duvall Darrell K | $175,000 | -- |
Source: Public Records
Mortgage History
| Date | Status | Borrower | Loan Amount |
|---|---|---|---|
| Open | Ennis Mark C | $230,375 | |
| Previous Owner | Duvall Darrell K | $140,000 |
Source: Public Records
Tax History Compared to Growth
Tax History
| Year | Tax Paid | Tax Assessment Tax Assessment Total Assessment is a certain percentage of the fair market value that is determined by local assessors to be the total taxable value of land and additions on the property. | Land | Improvement |
|---|---|---|---|---|
| 2024 | $4,006 | $159,640 | $27,800 | $131,840 |
| 2023 | $3,726 | $153,840 | $29,280 | $124,560 |
| 2022 | $3,297 | $137,120 | $26,600 | $110,520 |
| 2021 | $2,423 | $97,000 | $14,188 | $82,812 |
| 2020 | $4,499 | $104,440 | $15,280 | $89,160 |
| 2019 | $4,124 | $90,800 | $13,280 | $77,520 |
| 2018 | $3,296 | $72,040 | $12,600 | $59,440 |
| 2017 | $3,459 | $74,960 | $11,720 | $63,240 |
| 2016 | $3,219 | $69,680 | $9,760 | $59,920 |
| 2015 | $3,197 | $69,120 | $9,200 | $59,920 |
| 2014 | $3,230 | $69,120 | $9,200 | $59,920 |
| 2013 | -- | $68,920 | $14,000 | $54,920 |
Source: Public Records
Map
Nearby Homes
- 605 Trophy Ln
- 201 Thorn Berry Way
- 455 Sweet Water Trail SE
- 724 Cowan Rd SE
- 530 Valley Woods Cir SE
- 610 Camary Ct SE
- 450 Valley Woods Cir SE
- 1038 Plantation Blvd SE
- 586 Clubland Cir SE
- 550 Oglesby Bridge Rd SE
- 2950 Camary Place Dr SE
- 411 Willow Ct SE Unit 3
- 1061 Plantation Blvd SE
- 649 Sugar Creek Trail SE
- 599 Palmer Ct SE
- 604 Hamlet Ct SE
- 210 Cowan Rd SE
- 3991 Arbor Ln SE
- 1119 Plantation Dr SE
- 615 Heartwood Way SE
- 743 Lynn Milam Ln
- 749 Lynn Milam Ln Unit 4
- 0 Lynn Milam Ln Unit 8513838
- 0 Lynn Milam Ln Unit 3196436
- 0 Lynn Milam Ln Unit 7189758
- 0 Lynn Milam Ln Unit 8976048
- 0 Lynn Milam Ln Unit 9009173
- 0 Lynn Milam Ln Unit 9078220
- 0 Lynn Milam Ln Unit 2635923
- 0 Lynn Milam Ln Unit 3083941
- 0 Lynn Milam Ln Unit 3165733
- 0 Lynn Milam Ln Unit 3223616
- 0 Lynn Milam Ln Unit 3240088
- 0 Lynn Milam Ln Unit 3289506
- 0 Lynn Milam Ln Unit 7090683
- 0 Lynn Milam Ln Unit 7075481
- 0 Lynn Milam Ln Unit 7118926
- 0 Lynn Milam Ln Unit 7133553
- 0 Lynn Milam Ln Unit 7214980
- 0 Lynn Milam Ln Unit 7413255