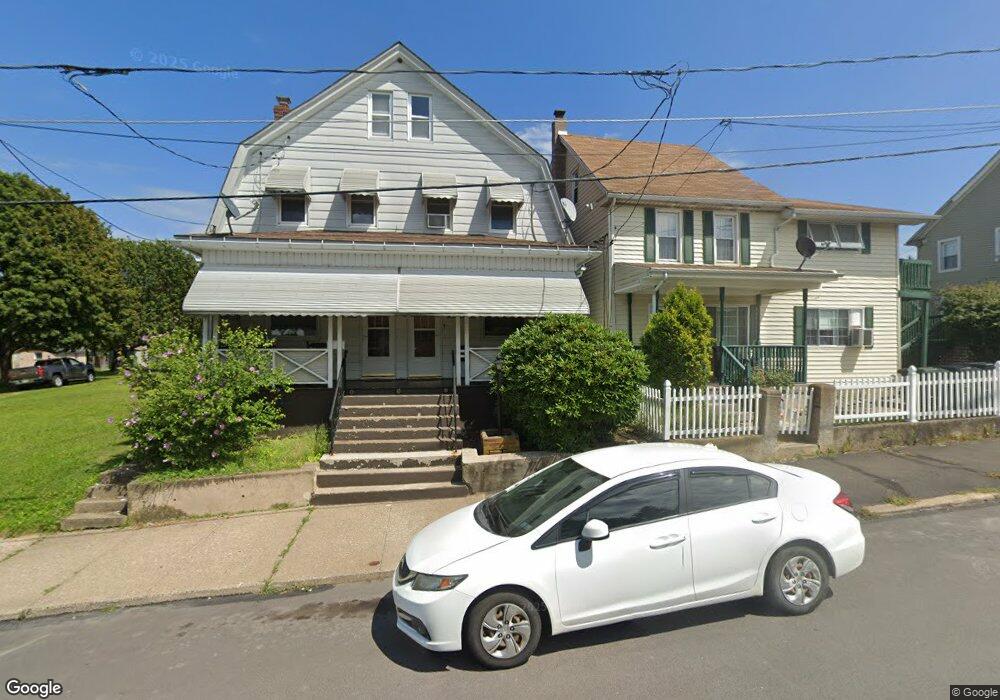
745 Mcnair St Hazleton, PA 18201
Estimated Value: $146,764 - $212,000
--
Bed
--
Bath
2,688
Sq Ft
$68/Sq Ft
Est. Value
About This Home
This home is located at 745 Mcnair St, Hazleton, PA 18201 and is currently estimated at $181,441, approximately $67 per square foot. 745 Mcnair St is a home located in Luzerne County with nearby schools including Hazleton Area High School, Immanuel Christian School, and Bishop Hafey Junior/Senior High School.
Ownership History
Date
Name
Owned For
Owner Type
Purchase Details
Closed on
Jul 19, 2022
Sold by
Fetchko Daniel J and Fetchko Margaret M
Bought by
Polanco Cristian
Current Estimated Value
Home Financials for this Owner
Home Financials are based on the most recent Mortgage that was taken out on this home.
Original Mortgage
$230,743
Outstanding Balance
$219,790
Interest Rate
5.23%
Mortgage Type
FHA
Estimated Equity
-$38,349
Purchase Details
Closed on
Feb 28, 1981
Bought by
Fetchko Daniel J and Fetchko Margaret
Create a Home Valuation Report for This Property
The Home Valuation Report is an in-depth analysis detailing your home's value as well as a comparison with similar homes in the area
Home Values in the Area
Average Home Value in this Area
Purchase History
| Date | Buyer | Sale Price | Title Company |
|---|---|---|---|
| Polanco Cristian | $240,000 | None Listed On Document | |
| Fetchko Daniel J | $22,900 | -- |
Source: Public Records
Mortgage History
| Date | Status | Borrower | Loan Amount |
|---|---|---|---|
| Open | Polanco Cristian | $230,743 |
Source: Public Records
Tax History Compared to Growth
Tax History
| Year | Tax Paid | Tax Assessment Tax Assessment Total Assessment is a certain percentage of the fair market value that is determined by local assessors to be the total taxable value of land and additions on the property. | Land | Improvement |
|---|---|---|---|---|
| 2025 | $1,752 | $61,000 | $20,200 | $40,800 |
| 2024 | $1,642 | $61,000 | $20,200 | $40,800 |
| 2023 | $1,535 | $61,000 | $20,200 | $40,800 |
| 2022 | $1,523 | $61,000 | $20,200 | $40,800 |
| 2021 | $1,488 | $61,000 | $20,200 | $40,800 |
| 2020 | $1,330 | $61,000 | $20,200 | $40,800 |
| 2019 | $1,372 | $61,000 | $20,200 | $40,800 |
| 2018 | $1,325 | $61,000 | $20,200 | $40,800 |
| 2017 | $1,222 | $61,000 | $20,200 | $40,800 |
| 2016 | $483 | $61,000 | $20,200 | $40,800 |
| 2015 | $450 | $61,000 | $20,200 | $40,800 |
| 2014 | $450 | $61,000 | $20,200 | $40,800 |
Source: Public Records
Map
Nearby Homes