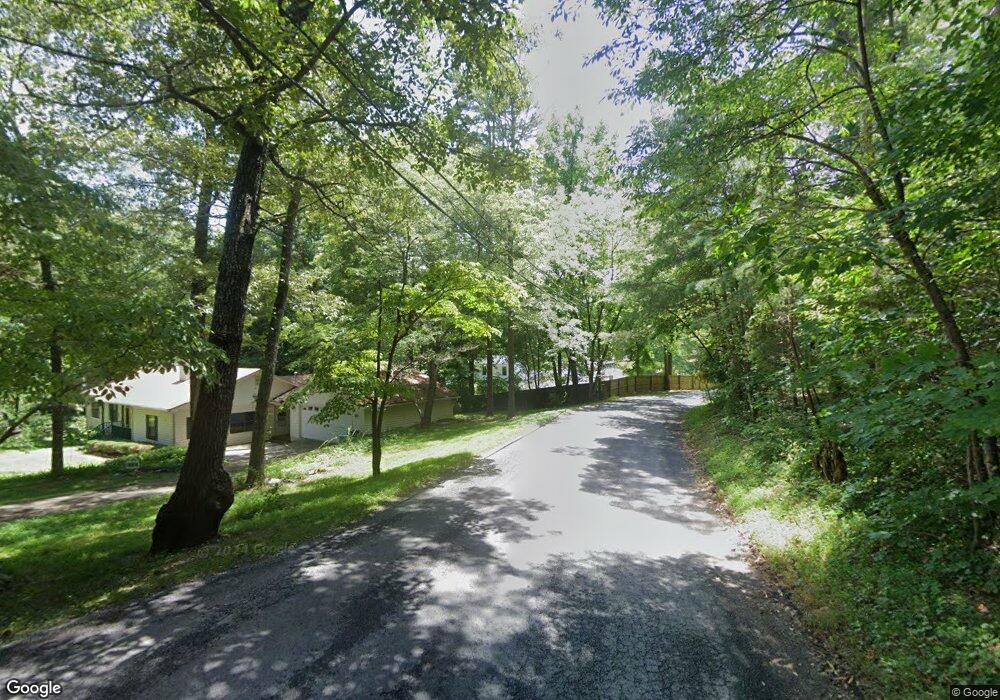
745 Old Bennett Rd Ellijay, GA 30536
Estimated Value: $388,993 - $473,000
4
Beds
2
Baths
1,766
Sq Ft
$249/Sq Ft
Est. Value
About This Home
This home is located at 745 Old Bennett Rd, Ellijay, GA 30536 and is currently estimated at $439,998, approximately $249 per square foot. 745 Old Bennett Rd is a home located in Gilmer County with nearby schools including Ellijay Elementary School, Gilmer Middle School, and Clear Creek Elementary School.
Ownership History
Date
Name
Owned For
Owner Type
Purchase Details
Closed on
Sep 14, 2022
Sold by
Moore Johnnie Sue
Bought by
Moore Johnnie Sue and Moore Jonathan Robert
Current Estimated Value
Purchase Details
Closed on
Feb 11, 2010
Sold by
Charles
Bought by
Moore Johnnie Sue
Purchase Details
Closed on
Aug 24, 2005
Sold by
Charles Elizabeth
Bought by
Moore Johnnie Sue
Create a Home Valuation Report for This Property
The Home Valuation Report is an in-depth analysis detailing your home's value as well as a comparison with similar homes in the area
Home Values in the Area
Average Home Value in this Area
Purchase History
| Date | Buyer | Sale Price | Title Company |
|---|---|---|---|
| Moore Johnnie Sue | -- | -- | |
| Moore Johnnie Sue | -- | -- | |
| Moore Johnnie Sue | -- | -- |
Source: Public Records
Tax History Compared to Growth
Tax History
| Year | Tax Paid | Tax Assessment Tax Assessment Total Assessment is a certain percentage of the fair market value that is determined by local assessors to be the total taxable value of land and additions on the property. | Land | Improvement |
|---|---|---|---|---|
| 2024 | $1,575 | $101,652 | $39,320 | $62,332 |
| 2023 | $1,596 | $99,772 | $37,440 | $62,332 |
| 2022 | $1,172 | $66,612 | $34,160 | $32,452 |
| 2021 | $1,035 | $52,172 | $24,960 | $27,212 |
| 2020 | $1,002 | $45,572 | $24,360 | $21,212 |
| 2019 | $1,043 | $46,072 | $24,360 | $21,712 |
| 2018 | $1,060 | $46,212 | $24,360 | $21,852 |
| 2017 | $1,068 | $43,392 | $24,360 | $19,032 |
| 2016 | -- | $43,656 | $24,360 | $19,296 |
| 2015 | -- | $35,876 | $17,400 | $18,476 |
| 2014 | -- | $33,204 | $17,400 | $15,804 |
Source: Public Records
Map
Nearby Homes
- 269 Old Orchard Rd
- 0 Aspen Ave Unit 1025047
- 0 Aspen Ave Unit 10501189
- 71 Black Walnut Place
- LOT 17 Misty Mountain Trail
- LOT 3 Ridgehaven Trail
- Lots 1-3 Ridgehaven Trail
- 0 Highway 52 W Unit 10598315
- 0 Highway 52 W Unit 7642027
- 118 E Oak St
- 31 Willow St
- 645 Riverside Dr
- 138.06 AC Georgia 515
- 138.06AC Georgia 515
- 216 Old Orchard Square
- 135 Hill St
- 0 Hill St
- LOT 6 Riverfront Dr
- LOT 5 Riverfront Dr
- LOT 4 Riverfront Dr
- L20 Aspen Ave Unit Lot 20
- L20 Aspen Ave
- Lot 8 Old Orchard Rd
- 178 Whispering Oaks Dr
- 178 Whispering Oaks Dr Unit 5
- 125 Old Orchard Rd
- 125 Old Orchard Rd Unit 1
- 68 Old Orchard Rd
- 527 Old Bennett Rd
- 149 Old Orchard Rd Unit 2
- 149 Old Orchard Rd
- 0 Whispering Oaks Dr Unit 8810391
- 0 Whispering Oaks Dr Unit 8510972
- 0 Whispering Oaks Dr Unit 7086812
- 0 Whispering Oaks Dr
- 168 Whispering Oaks Dr
- 25&27 Aspen Ave
- 67 Aspen Ave
- 689 Old Bennett Rd
- 22 Aspen Ave