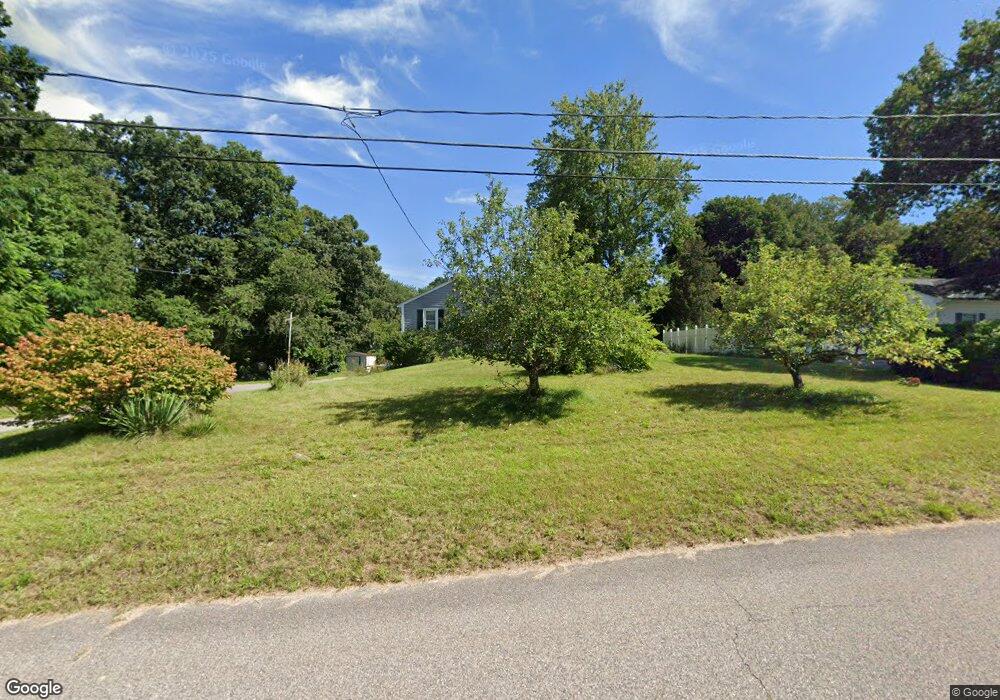
745 Rathbun St Blackstone, MA 01504
Estimated Value: $406,616 - $458,000
3
Beds
2
Baths
1,264
Sq Ft
$343/Sq Ft
Est. Value
About This Home
This home is located at 745 Rathbun St, Blackstone, MA 01504 and is currently estimated at $433,154, approximately $342 per square foot. 745 Rathbun St is a home located in Worcester County with nearby schools including Blackstone-Millville Regional High School, Rise Prep Mayoral Academy Middle School, and Rise Prep Mayoral Academy.
Ownership History
Date
Name
Owned For
Owner Type
Purchase Details
Closed on
Dec 12, 1997
Sold by
Cordima Joseph A and Cordima Simonetta M
Bought by
Stamant Wallace R and Stamant Sarah R
Current Estimated Value
Home Financials for this Owner
Home Financials are based on the most recent Mortgage that was taken out on this home.
Original Mortgage
$116,100
Outstanding Balance
$19,486
Interest Rate
7.14%
Mortgage Type
Purchase Money Mortgage
Estimated Equity
$413,668
Create a Home Valuation Report for This Property
The Home Valuation Report is an in-depth analysis detailing your home's value as well as a comparison with similar homes in the area
Home Values in the Area
Average Home Value in this Area
Purchase History
| Date | Buyer | Sale Price | Title Company |
|---|---|---|---|
| Stamant Wallace R | $93,000 | -- |
Source: Public Records
Mortgage History
| Date | Status | Borrower | Loan Amount |
|---|---|---|---|
| Open | Stamant Wallace R | $116,100 |
Source: Public Records
Tax History Compared to Growth
Tax History
| Year | Tax Paid | Tax Assessment Tax Assessment Total Assessment is a certain percentage of the fair market value that is determined by local assessors to be the total taxable value of land and additions on the property. | Land | Improvement |
|---|---|---|---|---|
| 2025 | $4,883 | $323,400 | $160,700 | $162,700 |
| 2024 | $5,119 | $313,500 | $168,700 | $144,800 |
| 2023 | $4,132 | $255,400 | $168,700 | $86,700 |
| 2022 | $4,300 | $240,200 | $153,500 | $86,700 |
| 2021 | $4,292 | $229,300 | $139,400 | $89,900 |
| 2020 | $4,702 | $249,300 | $139,400 | $109,900 |
| 2019 | $4,506 | $238,300 | $128,400 | $109,900 |
| 2018 | $4,280 | $219,600 | $122,300 | $97,300 |
| 2017 | $4,243 | $220,300 | $122,300 | $98,000 |
| 2016 | $4,222 | $218,300 | $114,300 | $104,000 |
| 2015 | $4,102 | $210,600 | $114,300 | $96,300 |
Source: Public Records
Map
Nearby Homes