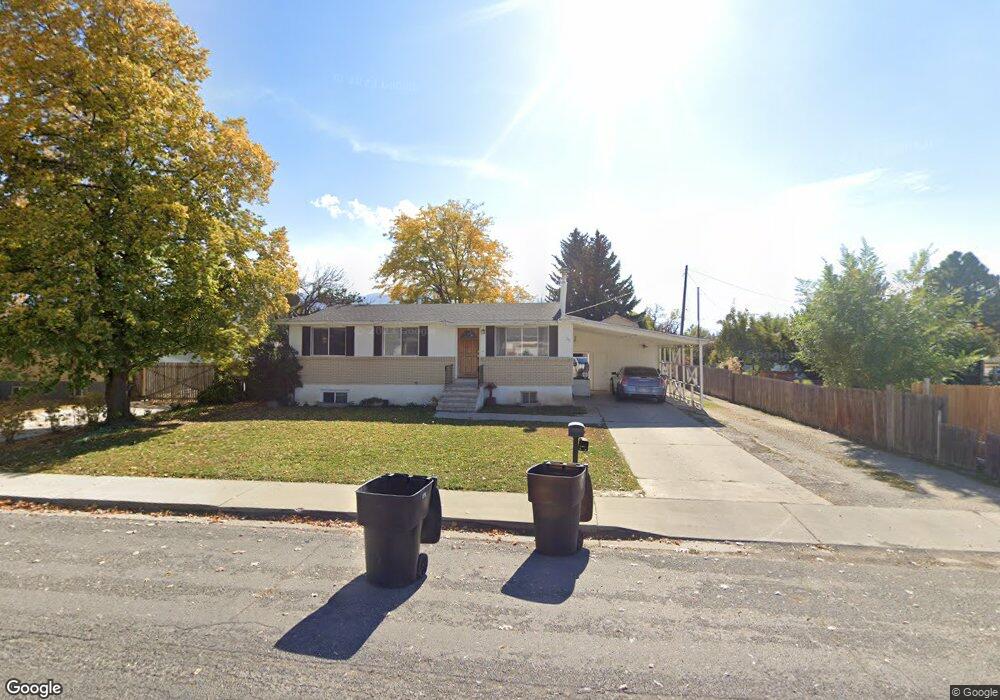
745 W 200 S Payson, UT 84651
Estimated Value: $442,000 - $467,000
5
Beds
2
Baths
2,464
Sq Ft
$184/Sq Ft
Est. Value
About This Home
This home is located at 745 W 200 S, Payson, UT 84651 and is currently estimated at $452,223, approximately $183 per square foot. 745 W 200 S is a home located in Utah County with nearby schools including Wilson Elementary School, Mt. Nebo Middle, and Payson Junior High School.
Ownership History
Date
Name
Owned For
Owner Type
Purchase Details
Closed on
Mar 28, 2018
Sold by
Mullen Robbin J and Mullen Tracey Lou
Bought by
Veasisi Asafi
Current Estimated Value
Purchase Details
Closed on
Oct 17, 1996
Sold by
Smith Madelin
Bought by
Mullen Robbin J and Mullen Tracey Lou
Home Financials for this Owner
Home Financials are based on the most recent Mortgage that was taken out on this home.
Original Mortgage
$87,000
Interest Rate
8.37%
Create a Home Valuation Report for This Property
The Home Valuation Report is an in-depth analysis detailing your home's value as well as a comparison with similar homes in the area
Home Values in the Area
Average Home Value in this Area
Purchase History
| Date | Buyer | Sale Price | Title Company |
|---|---|---|---|
| Veasisi Asafi | -- | North American Title | |
| Mullen Robbin J | -- | -- |
Source: Public Records
Mortgage History
| Date | Status | Borrower | Loan Amount |
|---|---|---|---|
| Previous Owner | Mullen Robbin J | $87,000 |
Source: Public Records
Tax History
| Year | Tax Paid | Tax Assessment Tax Assessment Total Assessment is a certain percentage of the fair market value that is determined by local assessors to be the total taxable value of land and additions on the property. | Land | Improvement |
|---|---|---|---|---|
| 2025 | $2,059 | $230,340 | -- | -- |
| 2024 | $2,059 | $209,550 | $0 | $0 |
| 2023 | $2,054 | $209,605 | $0 | $0 |
| 2022 | $2,106 | $211,420 | $0 | $0 |
| 2021 | $1,755 | $282,500 | $98,400 | $184,100 |
| 2020 | $1,638 | $258,000 | $85,600 | $172,400 |
| 2019 | $1,499 | $242,000 | $73,900 | $168,100 |
| 2018 | $1,340 | $208,500 | $62,300 | $146,200 |
| 2017 | $1,229 | $102,850 | $0 | $0 |
| 2016 | $1,185 | $98,560 | $0 | $0 |
| 2015 | $1,059 | $87,450 | $0 | $0 |
| 2014 | $936 | $77,825 | $0 | $0 |
Source: Public Records
Map
Nearby Homes
- 219 S Majestic W
- 221 S Majestic Meadows Dr
- 227 S Majestic Meadows Dr
- 742 W 400 S
- 588 W Utah Ave
- 533 S 700 W
- 527 S 1000 W
- 626 S 800 W Unit 32
- 128 S 300 W
- 116 S 300 W
- 845 W 400 N
- 195 W 300 N
- 451 N 500 W
- 451 N 500 W Unit 39
- 549 S Main St
- 1836 S 100 E
- 116 E 100 S
- 310 N 1500 W
- 118 E 100 N
- 383 W 625 N Unit A-D
Your Personal Tour Guide
Ask me questions while you tour the home.