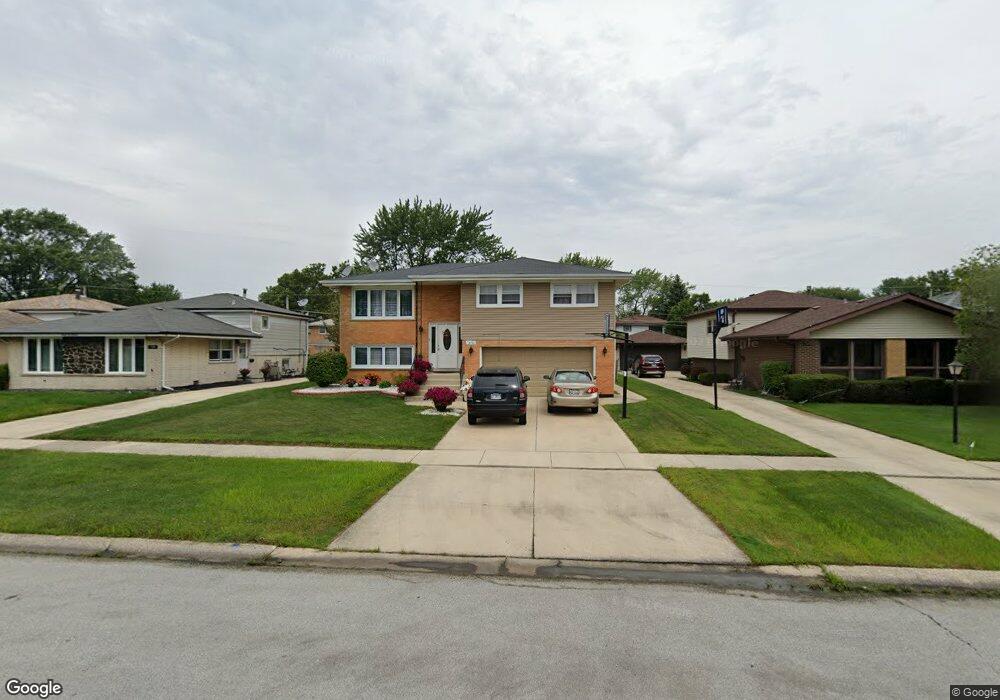
7450 173rd Place Tinley Park, IL 60477
Central Tinley Park NeighborhoodEstimated Value: $319,000 - $365,000
3
Beds
2
Baths
1,312
Sq Ft
$257/Sq Ft
Est. Value
About This Home
This home is located at 7450 173rd Place, Tinley Park, IL 60477 and is currently estimated at $337,601, approximately $257 per square foot. 7450 173rd Place is a home located in Cook County with nearby schools including John A Bannes Elementary School, Virgil I Grissom Middle School, and Victor J Andrew High School.
Ownership History
Date
Name
Owned For
Owner Type
Purchase Details
Closed on
Apr 11, 2007
Sold by
Slechta Michael J and Slechta Nicole
Bought by
Chrobak Jozef and Chrobak Aniela
Current Estimated Value
Home Financials for this Owner
Home Financials are based on the most recent Mortgage that was taken out on this home.
Original Mortgage
$180,000
Outstanding Balance
$109,072
Interest Rate
6.19%
Mortgage Type
Unknown
Estimated Equity
$228,529
Purchase Details
Closed on
Sep 24, 2004
Sold by
Black Mildred A
Bought by
Slechta Michael J and Slechta Nicole
Home Financials for this Owner
Home Financials are based on the most recent Mortgage that was taken out on this home.
Original Mortgage
$150,000
Interest Rate
5.86%
Mortgage Type
Unknown
Purchase Details
Closed on
Jan 21, 1994
Sold by
Haboian Tony and Haboian Elizabeth
Bought by
Black John E and Black Mildred A
Home Financials for this Owner
Home Financials are based on the most recent Mortgage that was taken out on this home.
Original Mortgage
$134,900
Interest Rate
7.31%
Create a Home Valuation Report for This Property
The Home Valuation Report is an in-depth analysis detailing your home's value as well as a comparison with similar homes in the area
Home Values in the Area
Average Home Value in this Area
Purchase History
| Date | Buyer | Sale Price | Title Company |
|---|---|---|---|
| Chrobak Jozef | $237,500 | Multiple | |
| Slechta Michael J | $219,000 | Ticor Title | |
| Black John E | $94,666 | -- |
Source: Public Records
Mortgage History
| Date | Status | Borrower | Loan Amount |
|---|---|---|---|
| Open | Chrobak Jozef | $180,000 | |
| Previous Owner | Slechta Michael J | $150,000 | |
| Previous Owner | Black John E | $134,900 |
Source: Public Records
Tax History Compared to Growth
Tax History
| Year | Tax Paid | Tax Assessment Tax Assessment Total Assessment is a certain percentage of the fair market value that is determined by local assessors to be the total taxable value of land and additions on the property. | Land | Improvement |
|---|---|---|---|---|
| 2024 | $6,298 | $26,000 | $3,825 | $22,175 |
| 2023 | $5,412 | $26,000 | $3,825 | $22,175 |
| 2022 | $5,412 | $18,601 | $2,709 | $15,892 |
| 2021 | $5,269 | $18,601 | $2,709 | $15,892 |
| 2020 | $5,209 | $18,601 | $2,709 | $15,892 |
| 2019 | $5,862 | $21,503 | $2,390 | $19,113 |
| 2018 | $5,734 | $21,503 | $2,390 | $19,113 |
| 2017 | $5,600 | $21,503 | $2,390 | $19,113 |
| 2016 | $5,577 | $19,289 | $2,231 | $17,058 |
| 2015 | $5,476 | $19,289 | $2,231 | $17,058 |
| 2014 | $5,447 | $19,289 | $2,231 | $17,058 |
| 2013 | $5,813 | $21,876 | $2,231 | $19,645 |
Source: Public Records
Map
Nearby Homes
- 7278 173rd Place
- 7727 Bristol Park Dr
- 7632 Hanover Dr
- 17116 Dooneen Ave
- 17436 71st Ave
- 7925 Belle Rive Ct
- 17377 71st Ave
- 7218 Sandy Ln
- 7783 Bristol Park Dr Unit 1-SW
- 17707 71st Ave
- 17700 70th Ct
- 17223 69th Ave
- 7841 Bristol Park Dr
- 7913 Paxton Ave Unit 1W
- 16750 Harlem Ave
- 16957 Sayre Ave
- 7925 Paxton Ave Unit 1A
- 7124 168th St
- 7938 Paxton Ave Unit 3E
- 16705 Paxton Ave
- 7500 173rd Place
- 7444 173rd Place
- 7504 173rd Place
- 7440 173rd Place
- 7501 173rd St
- 7451 173rd St
- 7505 173rd St
- 7508 173rd Place
- 7441 173rd St
- 7509 173rd St
- 7430 173rd Place
- 17310 Osceola Ave
- 7451 173rd Place
- 7514 173rd Place
- 7501 173rd Place
- 7445 173rd Place
- 17304 Osceola Ave
- 7515 173rd St
- 7505 173rd Place
- 7441 173rd Place