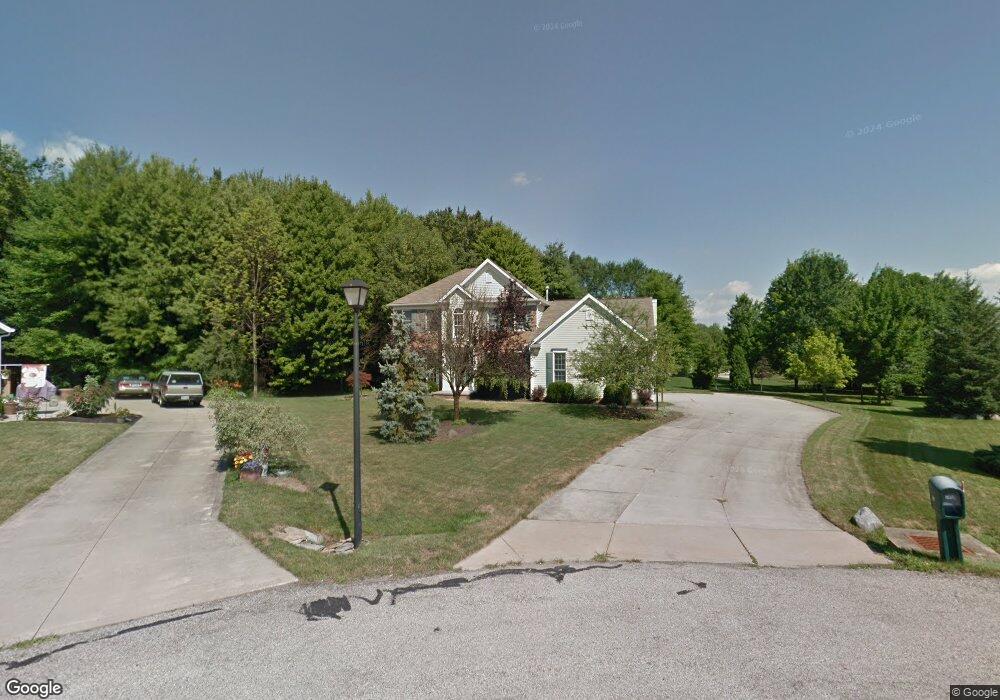
7450 Buoy Ct Northfield, OH 44067
Estimated Value: $408,101 - $442,000
3
Beds
3
Baths
2,146
Sq Ft
$201/Sq Ft
Est. Value
About This Home
This home is located at 7450 Buoy Ct, Northfield, OH 44067 and is currently estimated at $430,775, approximately $200 per square foot. 7450 Buoy Ct is a home located in Summit County with nearby schools including Lee Eaton Elementary School, Nordonia Middle School, and Nordonia High School.
Ownership History
Date
Name
Owned For
Owner Type
Purchase Details
Closed on
Apr 9, 2003
Sold by
Demming Thomas E and Demming Deborah L
Bought by
Parsons Doug C
Current Estimated Value
Home Financials for this Owner
Home Financials are based on the most recent Mortgage that was taken out on this home.
Original Mortgage
$188,800
Outstanding Balance
$78,841
Interest Rate
5.37%
Estimated Equity
$351,934
Purchase Details
Closed on
Aug 2, 1995
Sold by
Welcome Estates Ltd Ptns
Bought by
Demming Thomas E and Demming Deborah L
Home Financials for this Owner
Home Financials are based on the most recent Mortgage that was taken out on this home.
Original Mortgage
$155,900
Interest Rate
7.56%
Mortgage Type
New Conventional
Create a Home Valuation Report for This Property
The Home Valuation Report is an in-depth analysis detailing your home's value as well as a comparison with similar homes in the area
Home Values in the Area
Average Home Value in this Area
Purchase History
| Date | Buyer | Sale Price | Title Company |
|---|---|---|---|
| Parsons Doug C | $236,000 | Multiple | |
| Demming Thomas E | $49,900 | -- |
Source: Public Records
Mortgage History
| Date | Status | Borrower | Loan Amount |
|---|---|---|---|
| Open | Parsons Doug C | $188,800 | |
| Previous Owner | Demming Thomas E | $155,900 | |
| Closed | Parsons Doug C | $31,600 |
Source: Public Records
Tax History Compared to Growth
Tax History
| Year | Tax Paid | Tax Assessment Tax Assessment Total Assessment is a certain percentage of the fair market value that is determined by local assessors to be the total taxable value of land and additions on the property. | Land | Improvement |
|---|---|---|---|---|
| 2025 | $5,878 | $114,244 | $23,650 | $90,594 |
| 2024 | $5,878 | $114,244 | $23,650 | $90,594 |
| 2023 | $5,878 | $114,244 | $23,650 | $90,594 |
| 2022 | $5,102 | $82,314 | $17,014 | $65,300 |
| 2021 | $5,116 | $82,314 | $17,014 | $65,300 |
| 2020 | $5,034 | $82,310 | $17,010 | $65,300 |
| 2019 | $5,792 | $85,870 | $16,000 | $69,870 |
| 2018 | $5,107 | $85,870 | $16,000 | $69,870 |
| 2017 | $4,838 | $85,870 | $16,000 | $69,870 |
| 2016 | $4,789 | $77,290 | $16,000 | $61,290 |
| 2015 | $4,838 | $77,290 | $16,000 | $61,290 |
| 2014 | $4,809 | $77,290 | $16,000 | $61,290 |
| 2013 | $4,468 | $76,080 | $16,000 | $60,080 |
Source: Public Records
Map
Nearby Homes
- 100 Hazel Dr
- 0 E Oakmont Way
- 26 Woodbury Ln Unit 44
- 43 Woodbury Ln Unit 36
- 7739 Olde Eight Rd
- 8505 Olde 8 Rd
- 0 Capital Blvd
- 161 Marwyck Place Ln Unit 33
- 697 Brookledge Ct
- 8051 Wren Dr
- 0 Highland Valley View Rd E
- 7380 Walters Rd
- 8961 Lowell Ln
- 9105 Valley View Rd
- 930 Chinaberry Cir S
- 1051 Riviera Way
- 419 Mcneil Dr
- 50 Dover Place Ln
- 1143 Meadow Woods Dr
- 8282 Fairlane Dr