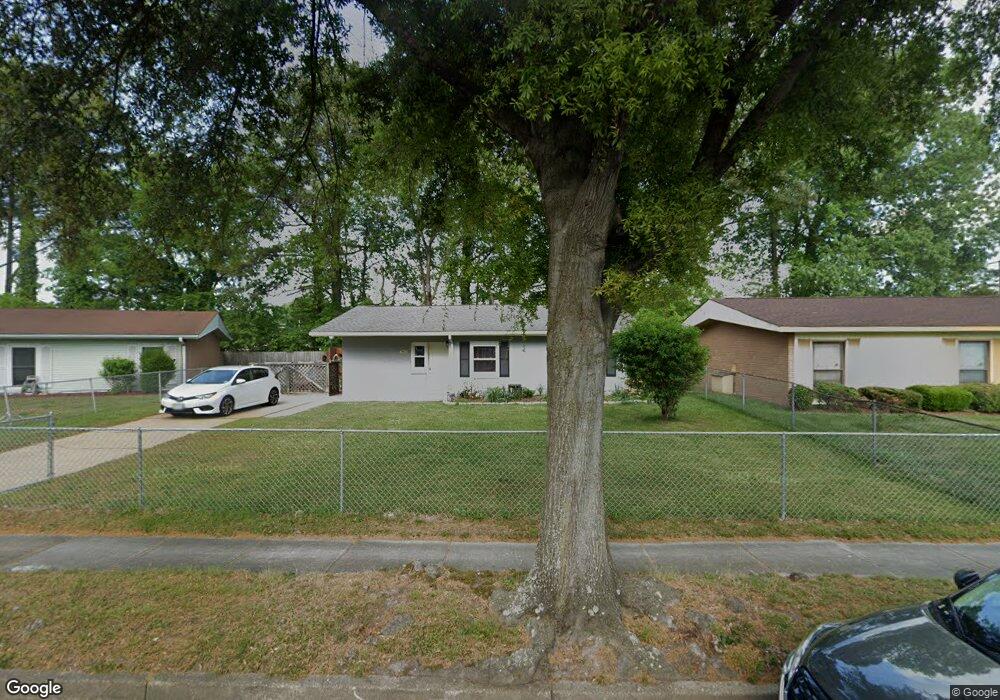
7452 Oakmont Dr Norfolk, VA 23513
Oakmont NeighborhoodEstimated Value: $240,000 - $264,000
3
Beds
2
Baths
1,143
Sq Ft
$221/Sq Ft
Est. Value
About This Home
This home is located at 7452 Oakmont Dr, Norfolk, VA 23513 and is currently estimated at $253,090, approximately $221 per square foot. 7452 Oakmont Dr is a home located in Norfolk City with nearby schools including Larrymore Elementary School, Norview Middle School, and Norview High School.
Ownership History
Date
Name
Owned For
Owner Type
Purchase Details
Closed on
Sep 22, 2021
Sold by
Thornton Donna M
Bought by
Louis Reginald and Mitchell Cecelia Evia
Current Estimated Value
Home Financials for this Owner
Home Financials are based on the most recent Mortgage that was taken out on this home.
Original Mortgage
$204,870
Outstanding Balance
$186,416
Interest Rate
2.8%
Mortgage Type
VA
Estimated Equity
$66,674
Purchase Details
Closed on
Sep 23, 2020
Sold by
Gass James C and Gass Carina
Bought by
Thornton Donna M
Purchase Details
Closed on
Jun 12, 2012
Sold by
Rsl Homes Llc
Bought by
Gass James C and Gass Carina
Home Financials for this Owner
Home Financials are based on the most recent Mortgage that was taken out on this home.
Original Mortgage
$124,623
Interest Rate
3.5%
Mortgage Type
New Conventional
Purchase Details
Closed on
May 4, 2010
Sold by
Johnson Louise D
Bought by
Rsl Homes Llc
Home Financials for this Owner
Home Financials are based on the most recent Mortgage that was taken out on this home.
Original Mortgage
$56,300
Interest Rate
10%
Mortgage Type
Purchase Money Mortgage
Create a Home Valuation Report for This Property
The Home Valuation Report is an in-depth analysis detailing your home's value as well as a comparison with similar homes in the area
Home Values in the Area
Average Home Value in this Area
Purchase History
| Date | Buyer | Sale Price | Title Company |
|---|---|---|---|
| Louis Reginald | $199,000 | True North Title | |
| Thornton Donna M | $175,000 | Landmark Title Llc | |
| Gass James C | $122,000 | Fidelity National Title Insu | |
| Rsl Homes Llc | $68,000 | Lawyers Title Insurance |
Source: Public Records
Mortgage History
| Date | Status | Borrower | Loan Amount |
|---|---|---|---|
| Open | Louis Reginald | $204,870 | |
| Previous Owner | Gass James C | $124,623 | |
| Previous Owner | Rsl Homes Llc | $56,300 |
Source: Public Records
Tax History Compared to Growth
Tax History
| Year | Tax Paid | Tax Assessment Tax Assessment Total Assessment is a certain percentage of the fair market value that is determined by local assessors to be the total taxable value of land and additions on the property. | Land | Improvement |
|---|---|---|---|---|
| 2025 | $2,624 | $209,900 | $63,000 | $146,900 |
| 2024 | $2,480 | $201,600 | $63,000 | $138,600 |
| 2023 | $2,420 | $193,600 | $57,400 | $136,200 |
| 2022 | $2,420 | $193,600 | $57,400 | $136,200 |
| 2021 | $2,033 | $162,600 | $42,500 | $120,100 |
| 2020 | $1,688 | $135,000 | $38,900 | $96,100 |
| 2019 | $1,654 | $132,300 | $36,200 | $96,100 |
| 2018 | $1,620 | $129,600 | $36,200 | $93,400 |
| 2017 | $1,451 | $126,200 | $36,200 | $90,000 |
| 2016 | $1,451 | $126,400 | $36,200 | $90,200 |
| 2015 | $1,393 | $126,400 | $36,200 | $90,200 |
| 2014 | $1,393 | $126,400 | $36,200 | $90,200 |
Source: Public Records
Map
Nearby Homes
- 7801 Caribou Ave
- 7923 Moose Ave
- 7929 Pythian Ave
- 977 Avenue G
- 935 Avenue I
- 7446 Davidson St
- 1072 Kane St
- 8016 Chesapeake Blvd
- 1044 Kane St
- 1331 Branch Rd
- 1747 Kingsway Rd
- 8068 Moose Ave
- 1555 Crane Ave
- 8205 Carlton St
- 7945 Merritt St
- 1041 Tifton St
- 6931 Chironna Place
- 1112 Newell Ave
- 8045 Westcliff Dr
- 8240 Fernwood Dr
- 7448 Oakmont Dr
- 7456 Oakmont Dr
- 7444 Oakmont Dr
- 1300 Oakmont Place
- 7460 Oakmont Dr
- 7464 Oakmont Dr
- 7440 Oakmont Dr
- 7443 Oakmont Dr
- 7463 Oakmont Dr
- 1304 Oakmont Place
- 7459 Oakmont Dr
- 7436 Oakmont Dr
- 1308 Oakmont Place
- 1305 Oakmont Place
- 7435 Oakmont Dr
- 7432 Oakmont Dr
- 1312 Oakmont Place
- 1309 Oakmont Place
- 7431 Oakmont Dr
- 7428 Oakmont Dr