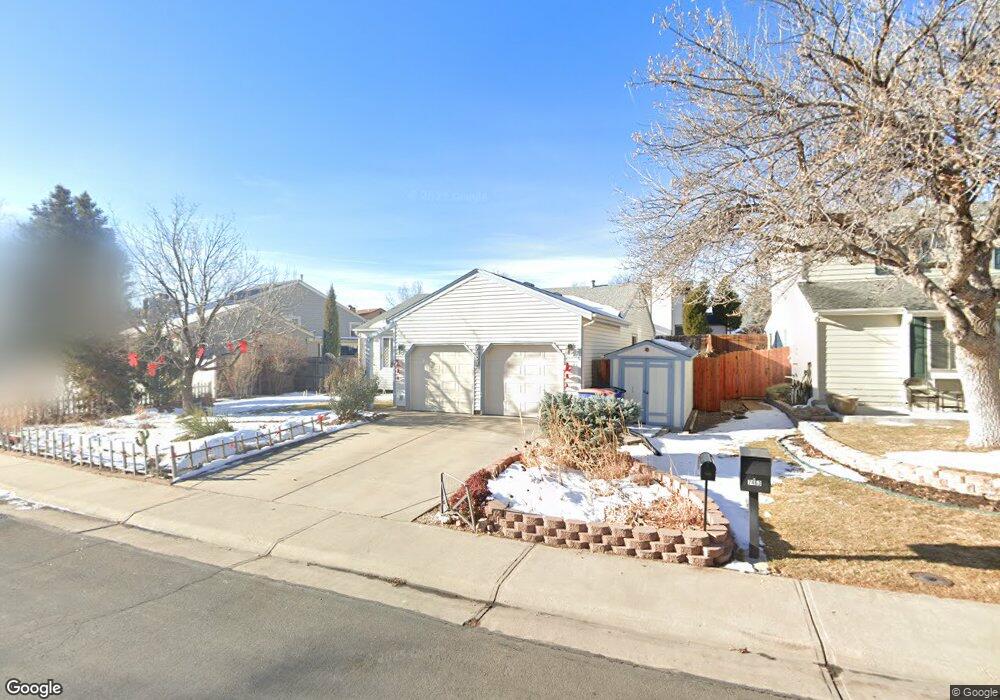
7453 Benton St Arvada, CO 80003
Wood Creek NeighborhoodEstimated Value: $504,142 - $604,000
3
Beds
5
Baths
1,203
Sq Ft
$456/Sq Ft
Est. Value
About This Home
This home is located at 7453 Benton St, Arvada, CO 80003 and is currently estimated at $548,036, approximately $455 per square foot. 7453 Benton St is a home located in Jefferson County with nearby schools including Swanson Elementary School, North Arvada Middle School, and Arvada High School.
Ownership History
Date
Name
Owned For
Owner Type
Purchase Details
Closed on
Sep 17, 2002
Sold by
Harrison Marilyn Jo and Opl Steven C
Bought by
Opl Jo Harrison and Opl Steven C
Current Estimated Value
Home Financials for this Owner
Home Financials are based on the most recent Mortgage that was taken out on this home.
Original Mortgage
$129,000
Interest Rate
6.26%
Purchase Details
Closed on
Feb 27, 1998
Sold by
Chris Anderson
Bought by
Opl Steven C and Harrison Marilyn Jo
Home Financials for this Owner
Home Financials are based on the most recent Mortgage that was taken out on this home.
Original Mortgage
$120,900
Interest Rate
7.01%
Purchase Details
Closed on
Sep 13, 1995
Sold by
Behrick Guy W
Bought by
Anderson Chris
Home Financials for this Owner
Home Financials are based on the most recent Mortgage that was taken out on this home.
Original Mortgage
$113,088
Interest Rate
7.78%
Mortgage Type
FHA
Create a Home Valuation Report for This Property
The Home Valuation Report is an in-depth analysis detailing your home's value as well as a comparison with similar homes in the area
Home Values in the Area
Average Home Value in this Area
Purchase History
| Date | Buyer | Sale Price | Title Company |
|---|---|---|---|
| Opl Jo Harrison | -- | -- | |
| Opl Steven C | $137,900 | Land Title | |
| Anderson Chris | $114,000 | Land Title |
Source: Public Records
Mortgage History
| Date | Status | Borrower | Loan Amount |
|---|---|---|---|
| Closed | Opl Jo Harrison | $129,000 | |
| Closed | Opl Steven C | $120,900 | |
| Previous Owner | Anderson Chris | $113,088 |
Source: Public Records
Tax History
| Year | Tax Paid | Tax Assessment Tax Assessment Total Assessment is a certain percentage of the fair market value that is determined by local assessors to be the total taxable value of land and additions on the property. | Land | Improvement |
|---|---|---|---|---|
| 2024 | $1,822 | $30,630 | $8,313 | $22,317 |
| 2023 | $1,822 | $30,630 | $8,313 | $22,317 |
| 2022 | $1,479 | $25,971 | $7,653 | $18,318 |
| 2021 | $1,501 | $26,718 | $7,873 | $18,845 |
| 2020 | $1,338 | $24,696 | $7,517 | $17,179 |
| 2019 | $1,317 | $24,696 | $7,517 | $17,179 |
| 2018 | $1,095 | $21,312 | $5,827 | $15,485 |
| 2017 | $981 | $21,312 | $5,827 | $15,485 |
| 2016 | $872 | $19,605 | $5,422 | $14,183 |
| 2015 | $1,229 | $21,024 | $5,422 | $15,602 |
| 2014 | $1,229 | $15,291 | $5,126 | $10,165 |
Source: Public Records
Map
Nearby Homes
- 7443 Benton St
- 7455 Chase St
- 7505 Chase St
- 5597 W 75th Place
- 7363 Chase St
- 5341 W 76th Ave Unit 213
- 5321 W 76th Ave Unit 322
- 5692 W 75th Place
- 5565 W 76th Ave Unit 1204
- 5730 W 74th Ave
- 5792 W 75th Place
- 5549 W 72nd Place
- 7680 Depew St Unit 1424
- 4851 W 73rd Ave Unit 4851
- 4839 W 73rd Ave Unit 4839
- 4835 W 73rd Ave Unit 4835
- 7471 Winona Ct
- 7104 Yates St
- 7121 Xavier St
- 7074 Yates St
Your Personal Tour Guide
Ask me questions while you tour the home.