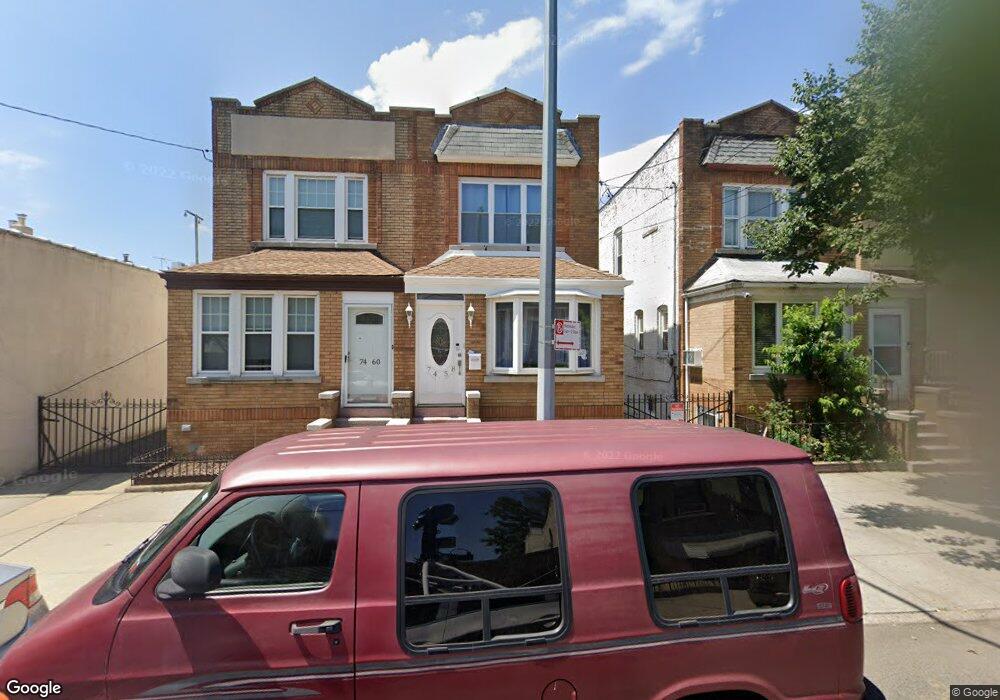
7458 65th St Glendale, NY 11385
Glendale NeighborhoodEstimated Value: $791,000 - $1,145,000
3
Beds
3
Baths
1,200
Sq Ft
$803/Sq Ft
Est. Value
About This Home
This home is located at 7458 65th St, Glendale, NY 11385 and is currently estimated at $963,167, approximately $802 per square foot. 7458 65th St is a home located in Queens County with nearby schools including P.S. 91 - Richard Arkwright, Joseph F. Quinn Intermediate School 77, and Elm Community Charter School.
Ownership History
Date
Name
Owned For
Owner Type
Purchase Details
Closed on
May 4, 2017
Sold by
Bugatti Roxana and Rizea Roxana
Bought by
Klusek Angelika Motyka and Klusek Lukasz
Current Estimated Value
Home Financials for this Owner
Home Financials are based on the most recent Mortgage that was taken out on this home.
Original Mortgage
$719,100
Outstanding Balance
$597,249
Interest Rate
4.14%
Mortgage Type
Purchase Money Mortgage
Estimated Equity
$365,918
Purchase Details
Closed on
Feb 9, 2007
Sold by
Lopez Joe and Lopez Marisol
Bought by
Bugatti Roxana
Home Financials for this Owner
Home Financials are based on the most recent Mortgage that was taken out on this home.
Original Mortgage
$464,000
Interest Rate
6.23%
Purchase Details
Closed on
Apr 11, 2001
Sold by
Desandis Laurence
Bought by
Lopez Marisol and Lopez Joe
Home Financials for this Owner
Home Financials are based on the most recent Mortgage that was taken out on this home.
Original Mortgage
$213,150
Interest Rate
6.85%
Mortgage Type
Purchase Money Mortgage
Create a Home Valuation Report for This Property
The Home Valuation Report is an in-depth analysis detailing your home's value as well as a comparison with similar homes in the area
Home Values in the Area
Average Home Value in this Area
Purchase History
| Date | Buyer | Sale Price | Title Company |
|---|---|---|---|
| Klusek Angelika Motyka | $799,000 | -- | |
| Bugatti Roxana | $580,000 | -- | |
| Bugatti Roxana | $580,000 | -- | |
| Lopez Marisol | -- | -- | |
| Lopez Marisol | -- | -- |
Source: Public Records
Mortgage History
| Date | Status | Borrower | Loan Amount |
|---|---|---|---|
| Open | Klusek Angelika Motyka | $719,100 | |
| Previous Owner | Bugatti Roxana | $464,000 | |
| Previous Owner | Lopez Marisol | $213,150 | |
| Closed | Bugatti Roxana | $116,000 |
Source: Public Records
Tax History Compared to Growth
Tax History
| Year | Tax Paid | Tax Assessment Tax Assessment Total Assessment is a certain percentage of the fair market value that is determined by local assessors to be the total taxable value of land and additions on the property. | Land | Improvement |
|---|---|---|---|---|
| 2025 | $6,257 | $32,724 | $11,494 | $21,230 |
| 2024 | $6,257 | $31,151 | $11,323 | $19,828 |
| 2023 | $6,117 | $30,456 | $9,607 | $20,849 |
| 2022 | $5,761 | $45,780 | $13,740 | $32,040 |
| 2021 | $5,739 | $38,820 | $13,740 | $25,080 |
| 2020 | $5,772 | $42,660 | $13,740 | $28,920 |
| 2019 | $5,430 | $40,620 | $13,740 | $26,880 |
| 2018 | $5,174 | $25,380 | $8,753 | $16,627 |
| 2017 | $4,603 | $24,048 | $9,940 | $14,108 |
| 2016 | $4,233 | $24,048 | $9,940 | $14,108 |
| 2015 | $2,516 | $22,725 | $14,633 | $8,092 |
| 2014 | $2,516 | $21,633 | $13,010 | $8,623 |
Source: Public Records
Map
Nearby Homes
- 7520 64th Place
- 74-40 65th St
- 647 Cooper Ave
- 74-33 65th St
- 65 Cooper Square Unit 3A
- 65 Cooper Square Unit 3B
- 7402 65th St
- 7447 62nd St
- 7818 65th St
- 73-30 72 St
- 78-24 64th Ln
- 78-30 64th Ln
- 7830 64th Ln
- 75-16 62nd St
- 61-29 Cooper Ave
- 7842 64th Ln
- 75-27 61st St
- 77-20 62nd St
- 7846 64th Place
- 6510 80th Ave